Immigrants from Belgium vs Moroccan GED/Equivalency
COMPARE
Immigrants from Belgium
Moroccan
GED/Equivalency
GED/Equivalency Comparison
Immigrants from Belgium
Moroccans
88.3%
GED/EQUIVALENCY
99.7/ 100
METRIC RATING
36th/ 347
METRIC RANK
85.5%
GED/EQUIVALENCY
37.7/ 100
METRIC RATING
181st/ 347
METRIC RANK
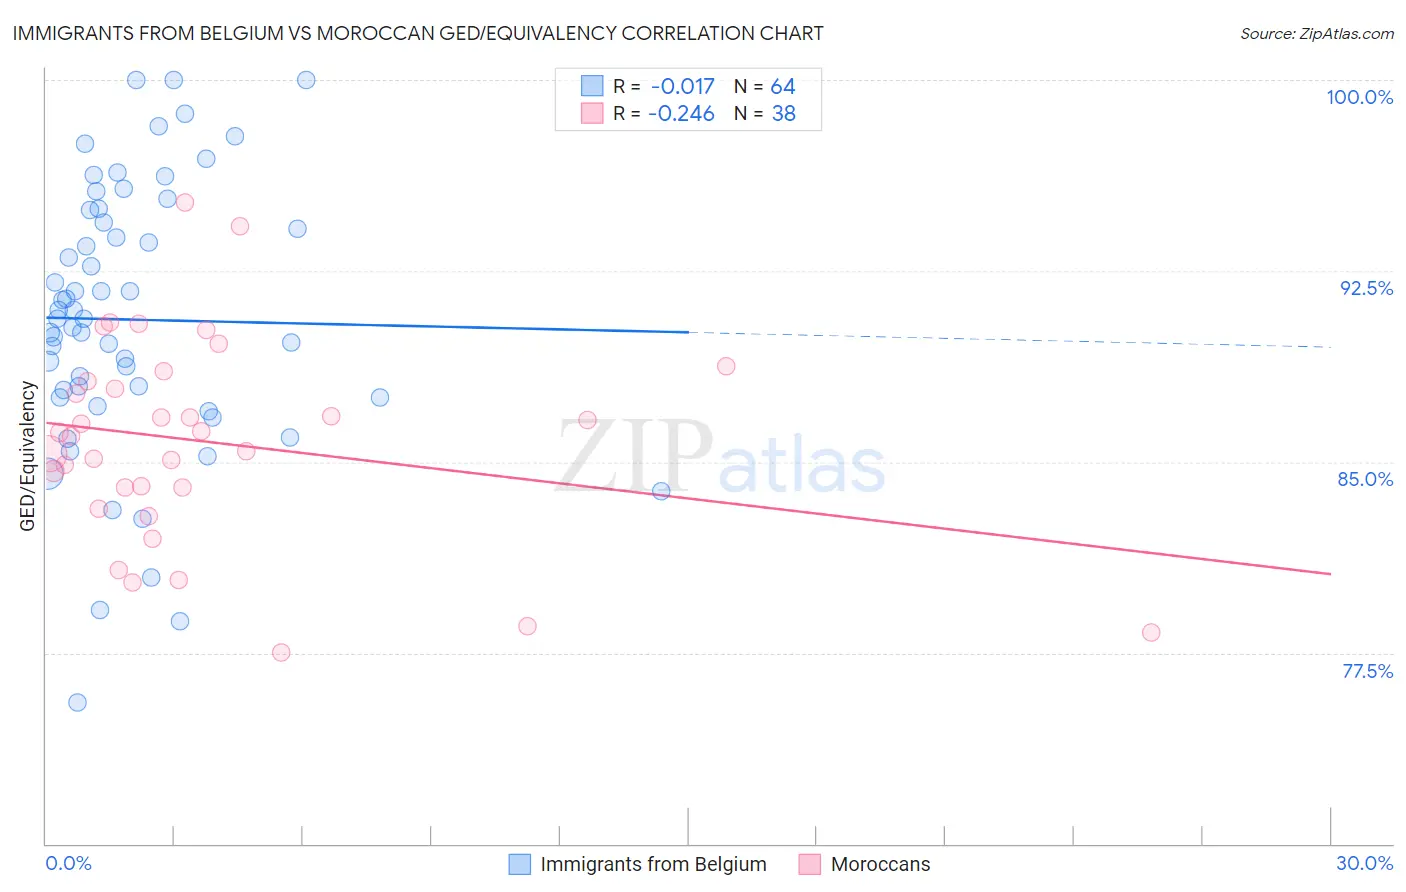
Immigrants from Belgium vs Moroccan GED/Equivalency Correlation Chart
The statistical analysis conducted on geographies consisting of 146,727,159 people shows no correlation between the proportion of Immigrants from Belgium and percentage of population with at least ged/equivalency education in the United States with a correlation coefficient (R) of -0.017 and weighted average of 88.3%. Similarly, the statistical analysis conducted on geographies consisting of 201,817,353 people shows a weak negative correlation between the proportion of Moroccans and percentage of population with at least ged/equivalency education in the United States with a correlation coefficient (R) of -0.246 and weighted average of 85.5%, a difference of 3.3%.
GED/Equivalency Correlation Summary
| Measurement | Immigrants from Belgium | Moroccan |
| Minimum | 75.5% | 77.5% |
| Maximum | 100.0% | 95.2% |
| Range | 24.5% | 17.7% |
| Mean | 90.6% | 85.8% |
| Median | 90.6% | 86.1% |
| Interquartile 25% (IQ1) | 87.5% | 84.0% |
| Interquartile 75% (IQ3) | 94.6% | 88.2% |
| Interquartile Range (IQR) | 7.1% | 4.2% |
| Standard Deviation (Sample) | 5.4% | 4.0% |
| Standard Deviation (Population) | 5.3% | 4.0% |
Similar Demographics by GED/Equivalency
Demographics Similar to Immigrants from Belgium by GED/Equivalency
In terms of ged/equivalency, the demographic groups most similar to Immigrants from Belgium are Immigrants from South Central Asia (88.4%, a difference of 0.020%), Immigrants from Austria (88.3%, a difference of 0.030%), Immigrants from Japan (88.4%, a difference of 0.040%), Immigrants from Sweden (88.4%, a difference of 0.050%), and Burmese (88.3%, a difference of 0.060%).
| Demographics | Rating | Rank | GED/Equivalency |
| Poles | 99.8 /100 | #29 | Exceptional 88.5% |
| Turks | 99.8 /100 | #30 | Exceptional 88.5% |
| Bhutanese | 99.8 /100 | #31 | Exceptional 88.4% |
| Danes | 99.8 /100 | #32 | Exceptional 88.4% |
| Immigrants | Sweden | 99.7 /100 | #33 | Exceptional 88.4% |
| Immigrants | Japan | 99.7 /100 | #34 | Exceptional 88.4% |
| Immigrants | South Central Asia | 99.7 /100 | #35 | Exceptional 88.4% |
| Immigrants | Belgium | 99.7 /100 | #36 | Exceptional 88.3% |
| Immigrants | Austria | 99.7 /100 | #37 | Exceptional 88.3% |
| Burmese | 99.7 /100 | #38 | Exceptional 88.3% |
| Immigrants | Israel | 99.6 /100 | #39 | Exceptional 88.2% |
| Italians | 99.6 /100 | #40 | Exceptional 88.2% |
| Finns | 99.6 /100 | #41 | Exceptional 88.2% |
| Cambodians | 99.6 /100 | #42 | Exceptional 88.2% |
| Immigrants | Scotland | 99.6 /100 | #43 | Exceptional 88.2% |
Demographics Similar to Moroccans by GED/Equivalency
In terms of ged/equivalency, the demographic groups most similar to Moroccans are Immigrants from Southern Europe (85.5%, a difference of 0.020%), Aleut (85.6%, a difference of 0.060%), Sudanese (85.5%, a difference of 0.060%), Korean (85.6%, a difference of 0.080%), and Immigrants from Sudan (85.5%, a difference of 0.080%).
| Demographics | Rating | Rank | GED/Equivalency |
| Ottawa | 50.0 /100 | #174 | Average 85.8% |
| Immigrants | Bolivia | 49.8 /100 | #175 | Average 85.8% |
| Immigrants | Eastern Africa | 47.7 /100 | #176 | Average 85.7% |
| Immigrants | Uganda | 45.2 /100 | #177 | Average 85.7% |
| Koreans | 41.2 /100 | #178 | Average 85.6% |
| Aleuts | 40.5 /100 | #179 | Average 85.6% |
| Immigrants | Southern Europe | 38.4 /100 | #180 | Fair 85.5% |
| Moroccans | 37.7 /100 | #181 | Fair 85.5% |
| Sudanese | 35.2 /100 | #182 | Fair 85.5% |
| Immigrants | Sudan | 34.2 /100 | #183 | Fair 85.5% |
| Immigrants | Oceania | 33.6 /100 | #184 | Fair 85.5% |
| Spanish | 32.8 /100 | #185 | Fair 85.4% |
| Spaniards | 31.9 /100 | #186 | Fair 85.4% |
| Immigrants | Afghanistan | 29.8 /100 | #187 | Fair 85.4% |
| Immigrants | Sierra Leone | 29.0 /100 | #188 | Fair 85.4% |