Immigrants from Nicaragua vs Immigrants from England GED/Equivalency
COMPARE
Immigrants from Nicaragua
Immigrants from England
GED/Equivalency
GED/Equivalency Comparison
Immigrants from Nicaragua
Immigrants from England
79.9%
GED/EQUIVALENCY
0.0/ 100
METRIC RATING
323rd/ 347
METRIC RANK
87.6%
GED/EQUIVALENCY
98.5/ 100
METRIC RATING
80th/ 347
METRIC RANK
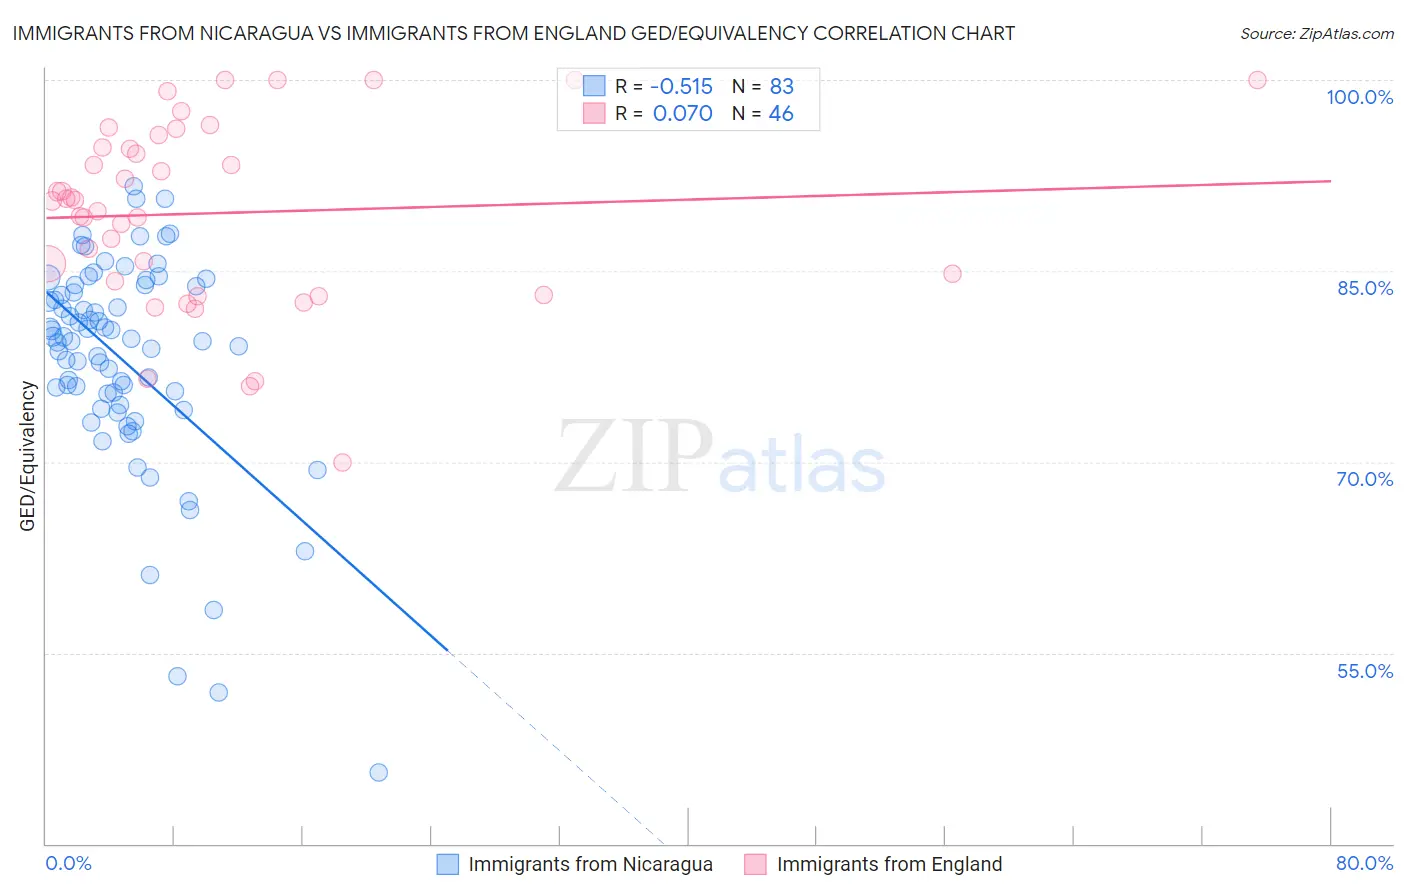
Immigrants from Nicaragua vs Immigrants from England GED/Equivalency Correlation Chart
The statistical analysis conducted on geographies consisting of 236,340,156 people shows a substantial negative correlation between the proportion of Immigrants from Nicaragua and percentage of population with at least ged/equivalency education in the United States with a correlation coefficient (R) of -0.515 and weighted average of 79.9%. Similarly, the statistical analysis conducted on geographies consisting of 391,897,612 people shows a slight positive correlation between the proportion of Immigrants from England and percentage of population with at least ged/equivalency education in the United States with a correlation coefficient (R) of 0.070 and weighted average of 87.6%, a difference of 9.7%.
GED/Equivalency Correlation Summary
| Measurement | Immigrants from Nicaragua | Immigrants from England |
| Minimum | 45.6% | 70.0% |
| Maximum | 91.7% | 100.0% |
| Range | 46.1% | 30.0% |
| Mean | 77.9% | 89.5% |
| Median | 79.5% | 90.6% |
| Interquartile 25% (IQ1) | 74.4% | 84.2% |
| Interquartile 75% (IQ3) | 83.8% | 94.7% |
| Interquartile Range (IQR) | 9.3% | 10.5% |
| Standard Deviation (Sample) | 8.4% | 7.2% |
| Standard Deviation (Population) | 8.4% | 7.1% |
Similar Demographics by GED/Equivalency
Demographics Similar to Immigrants from Nicaragua by GED/Equivalency
In terms of ged/equivalency, the demographic groups most similar to Immigrants from Nicaragua are Lumbee (80.0%, a difference of 0.12%), Yup'ik (80.0%, a difference of 0.19%), Immigrants from Cuba (80.2%, a difference of 0.36%), Mexican American Indian (79.4%, a difference of 0.65%), and Honduran (79.3%, a difference of 0.76%).
| Demographics | Rating | Rank | GED/Equivalency |
| Central American Indians | 0.0 /100 | #316 | Tragic 80.6% |
| Immigrants | Caribbean | 0.0 /100 | #317 | Tragic 80.5% |
| Yaqui | 0.0 /100 | #318 | Tragic 80.5% |
| Immigrants | Belize | 0.0 /100 | #319 | Tragic 80.5% |
| Immigrants | Cuba | 0.0 /100 | #320 | Tragic 80.2% |
| Yup'ik | 0.0 /100 | #321 | Tragic 80.0% |
| Lumbee | 0.0 /100 | #322 | Tragic 80.0% |
| Immigrants | Nicaragua | 0.0 /100 | #323 | Tragic 79.9% |
| Mexican American Indians | 0.0 /100 | #324 | Tragic 79.4% |
| Hondurans | 0.0 /100 | #325 | Tragic 79.3% |
| Yuman | 0.0 /100 | #326 | Tragic 79.2% |
| Central Americans | 0.0 /100 | #327 | Tragic 79.2% |
| Hispanics or Latinos | 0.0 /100 | #328 | Tragic 79.1% |
| Dominicans | 0.0 /100 | #329 | Tragic 79.1% |
| Immigrants | Cabo Verde | 0.0 /100 | #330 | Tragic 78.9% |
Demographics Similar to Immigrants from England by GED/Equivalency
In terms of ged/equivalency, the demographic groups most similar to Immigrants from England are English (87.6%, a difference of 0.030%), Immigrants from Sri Lanka (87.5%, a difference of 0.040%), Romanian (87.5%, a difference of 0.050%), South African (87.5%, a difference of 0.050%), and Irish (87.6%, a difference of 0.060%).
| Demographics | Rating | Rank | GED/Equivalency |
| Belgians | 98.8 /100 | #73 | Exceptional 87.7% |
| Immigrants | Kuwait | 98.8 /100 | #74 | Exceptional 87.7% |
| Scottish | 98.7 /100 | #75 | Exceptional 87.7% |
| Immigrants | Serbia | 98.7 /100 | #76 | Exceptional 87.7% |
| Slavs | 98.7 /100 | #77 | Exceptional 87.7% |
| Irish | 98.6 /100 | #78 | Exceptional 87.6% |
| English | 98.6 /100 | #79 | Exceptional 87.6% |
| Immigrants | England | 98.5 /100 | #80 | Exceptional 87.6% |
| Immigrants | Sri Lanka | 98.3 /100 | #81 | Exceptional 87.5% |
| Romanians | 98.3 /100 | #82 | Exceptional 87.5% |
| South Africans | 98.3 /100 | #83 | Exceptional 87.5% |
| Immigrants | Romania | 98.1 /100 | #84 | Exceptional 87.5% |
| Dutch | 98.1 /100 | #85 | Exceptional 87.5% |
| Immigrants | Europe | 98.1 /100 | #86 | Exceptional 87.5% |
| Native Hawaiians | 98.1 /100 | #87 | Exceptional 87.5% |