Houma vs Lumbee High School Diploma
COMPARE
Houma
Lumbee
High School Diploma
High School Diploma Comparison
Houma
Lumbee
81.5%
HIGH SCHOOL DIPLOMA
0.0/ 100
METRIC RATING
340th/ 347
METRIC RANK
83.6%
HIGH SCHOOL DIPLOMA
0.0/ 100
METRIC RATING
322nd/ 347
METRIC RANK
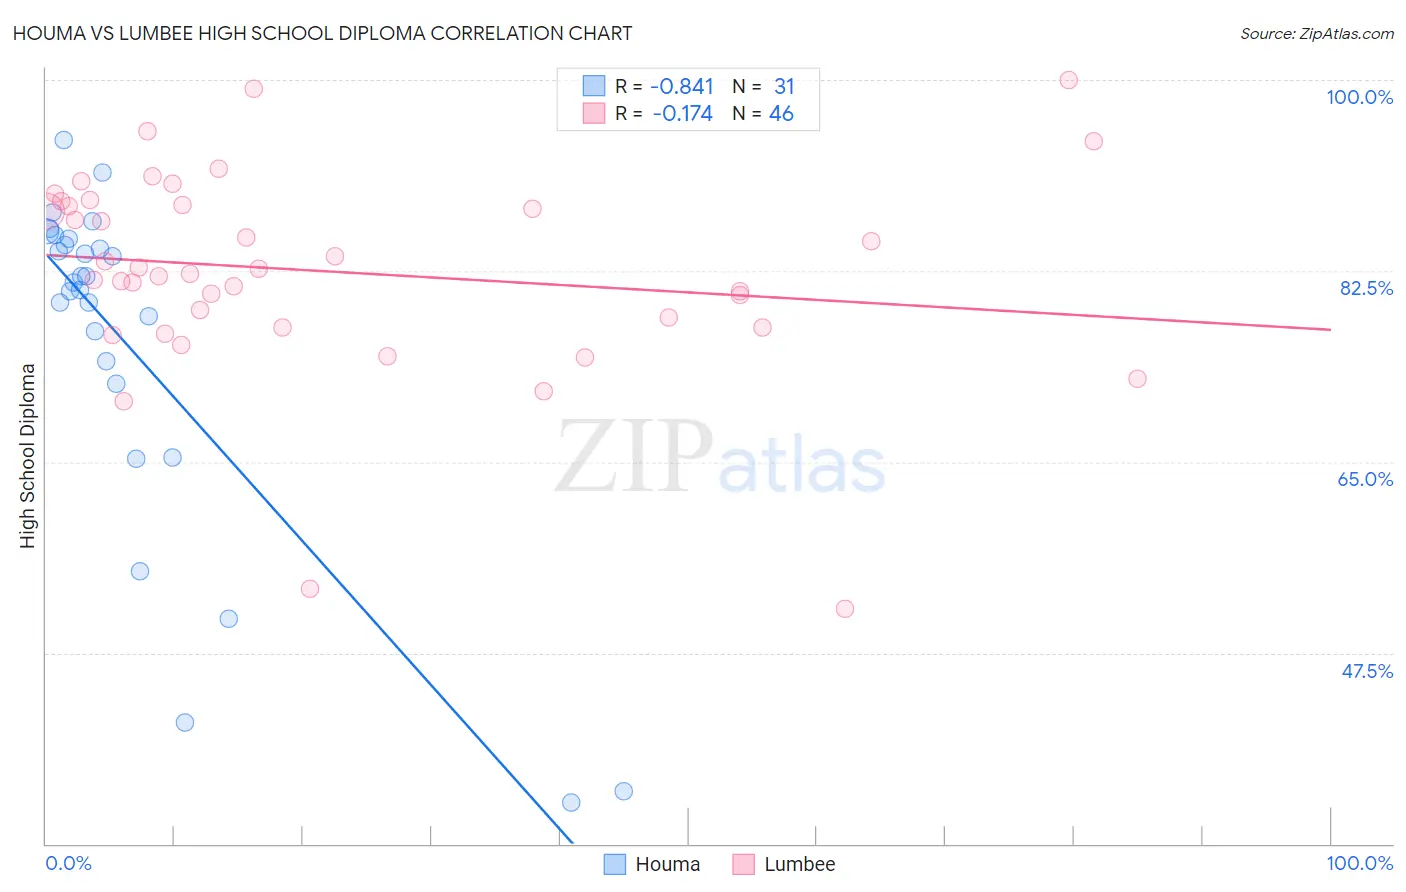
Houma vs Lumbee High School Diploma Correlation Chart
The statistical analysis conducted on geographies consisting of 36,795,916 people shows a very strong negative correlation between the proportion of Houma and percentage of population with at least high school diploma education in the United States with a correlation coefficient (R) of -0.841 and weighted average of 81.5%. Similarly, the statistical analysis conducted on geographies consisting of 92,299,068 people shows a poor negative correlation between the proportion of Lumbee and percentage of population with at least high school diploma education in the United States with a correlation coefficient (R) of -0.174 and weighted average of 83.6%, a difference of 2.6%.
High School Diploma Correlation Summary
| Measurement | Houma | Lumbee |
| Minimum | 33.8% | 51.6% |
| Maximum | 94.5% | 100.0% |
| Range | 60.8% | 48.4% |
| Mean | 75.5% | 82.4% |
| Median | 81.4% | 82.4% |
| Interquartile 25% (IQ1) | 72.2% | 77.3% |
| Interquartile 75% (IQ3) | 85.4% | 88.5% |
| Interquartile Range (IQR) | 13.2% | 11.2% |
| Standard Deviation (Sample) | 16.1% | 9.4% |
| Standard Deviation (Population) | 15.9% | 9.3% |
Demographics Similar to Houma and Lumbee by High School Diploma
In terms of high school diploma, the demographic groups most similar to Houma are Pima (81.6%, a difference of 0.11%), Mexican (81.4%, a difference of 0.15%), Salvadoran (81.7%, a difference of 0.20%), Immigrants from Yemen (81.8%, a difference of 0.38%), and Immigrants from Dominican Republic (82.0%, a difference of 0.52%). Similarly, the demographic groups most similar to Lumbee are Immigrants from Cuba (83.5%, a difference of 0.16%), Yuman (84.0%, a difference of 0.41%), Immigrants from Cabo Verde (83.3%, a difference of 0.45%), Immigrants from Nicaragua (83.1%, a difference of 0.68%), and Mexican American Indian (83.0%, a difference of 0.75%).
| Demographics | Rating | Rank | High School Diploma |
| Yuman | 0.0 /100 | #321 | Tragic 84.0% |
| Lumbee | 0.0 /100 | #322 | Tragic 83.6% |
| Immigrants | Cuba | 0.0 /100 | #323 | Tragic 83.5% |
| Immigrants | Cabo Verde | 0.0 /100 | #324 | Tragic 83.3% |
| Immigrants | Nicaragua | 0.0 /100 | #325 | Tragic 83.1% |
| Mexican American Indians | 0.0 /100 | #326 | Tragic 83.0% |
| Hondurans | 0.0 /100 | #327 | Tragic 83.0% |
| Dominicans | 0.0 /100 | #328 | Tragic 82.9% |
| Hispanics or Latinos | 0.0 /100 | #329 | Tragic 82.9% |
| Immigrants | Azores | 0.0 /100 | #330 | Tragic 82.8% |
| Central Americans | 0.0 /100 | #331 | Tragic 82.5% |
| Immigrants | Honduras | 0.0 /100 | #332 | Tragic 82.5% |
| Immigrants | Latin America | 0.0 /100 | #333 | Tragic 82.1% |
| Tohono O'odham | 0.0 /100 | #334 | Tragic 82.1% |
| Guatemalans | 0.0 /100 | #335 | Tragic 82.0% |
| Immigrants | Dominican Republic | 0.0 /100 | #336 | Tragic 82.0% |
| Immigrants | Yemen | 0.0 /100 | #337 | Tragic 81.8% |
| Salvadorans | 0.0 /100 | #338 | Tragic 81.7% |
| Pima | 0.0 /100 | #339 | Tragic 81.6% |
| Houma | 0.0 /100 | #340 | Tragic 81.5% |
| Mexicans | 0.0 /100 | #341 | Tragic 81.4% |