Houma vs Immigrants from Uruguay High School Diploma
COMPARE
Houma
Immigrants from Uruguay
High School Diploma
High School Diploma Comparison
Houma
Immigrants from Uruguay
81.5%
HIGH SCHOOL DIPLOMA
0.0/ 100
METRIC RATING
340th/ 347
METRIC RANK
87.6%
HIGH SCHOOL DIPLOMA
1.0/ 100
METRIC RATING
253rd/ 347
METRIC RANK
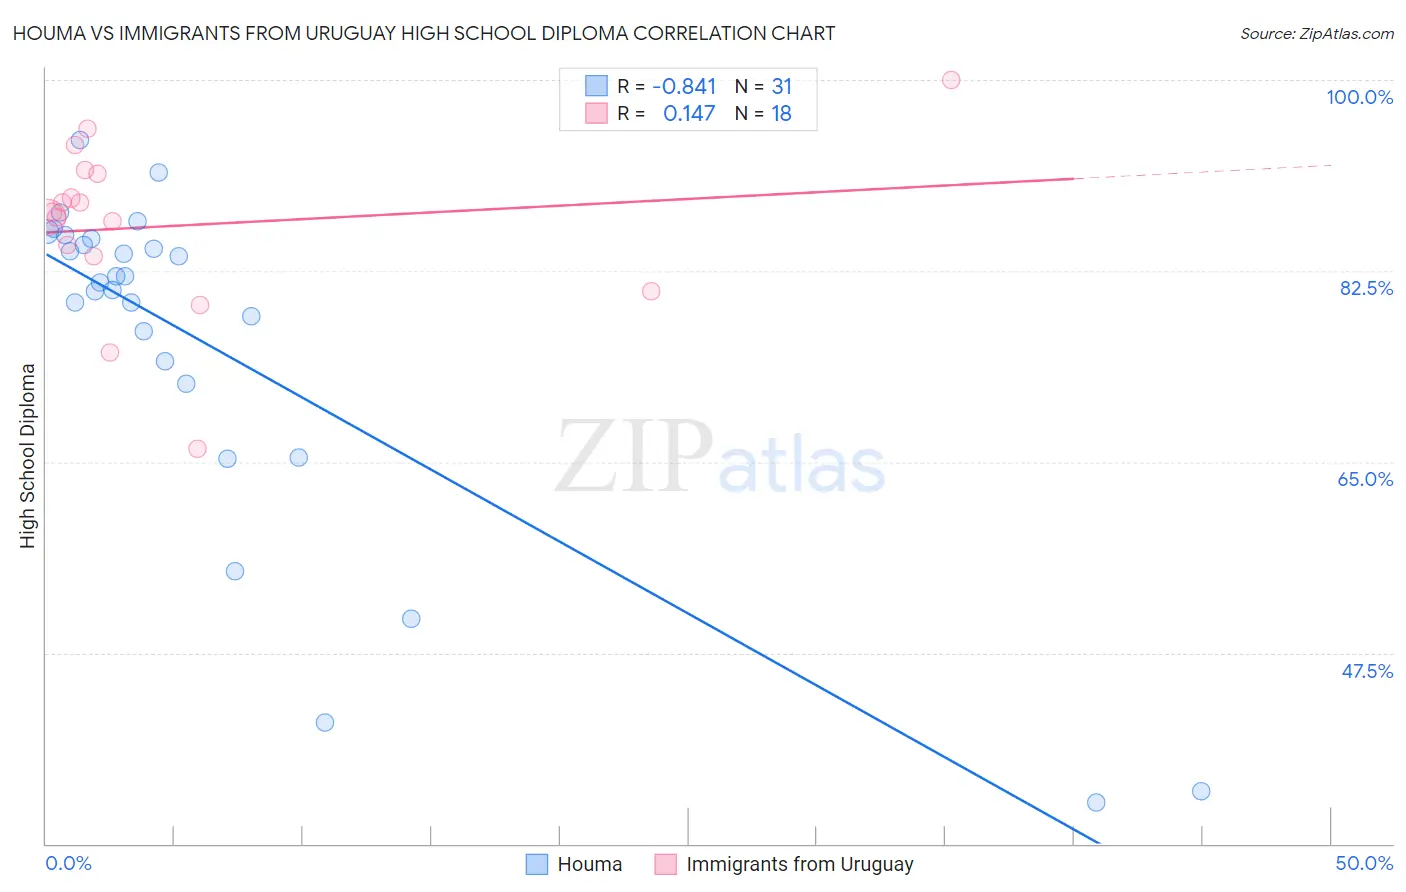
Houma vs Immigrants from Uruguay High School Diploma Correlation Chart
The statistical analysis conducted on geographies consisting of 36,795,916 people shows a very strong negative correlation between the proportion of Houma and percentage of population with at least high school diploma education in the United States with a correlation coefficient (R) of -0.841 and weighted average of 81.5%. Similarly, the statistical analysis conducted on geographies consisting of 133,259,667 people shows a poor positive correlation between the proportion of Immigrants from Uruguay and percentage of population with at least high school diploma education in the United States with a correlation coefficient (R) of 0.147 and weighted average of 87.6%, a difference of 7.5%.
High School Diploma Correlation Summary
| Measurement | Houma | Immigrants from Uruguay |
| Minimum | 33.8% | 66.2% |
| Maximum | 94.5% | 100.0% |
| Range | 60.8% | 33.8% |
| Mean | 75.5% | 86.6% |
| Median | 81.4% | 87.6% |
| Interquartile 25% (IQ1) | 72.2% | 83.8% |
| Interquartile 75% (IQ3) | 85.4% | 91.4% |
| Interquartile Range (IQR) | 13.2% | 7.6% |
| Standard Deviation (Sample) | 16.1% | 7.8% |
| Standard Deviation (Population) | 15.9% | 7.6% |
Similar Demographics by High School Diploma
Demographics Similar to Houma by High School Diploma
In terms of high school diploma, the demographic groups most similar to Houma are Pima (81.6%, a difference of 0.11%), Mexican (81.4%, a difference of 0.15%), Salvadoran (81.7%, a difference of 0.20%), Immigrants from Guatemala (81.4%, a difference of 0.20%), and Immigrants from Yemen (81.8%, a difference of 0.38%).
| Demographics | Rating | Rank | High School Diploma |
| Immigrants | Latin America | 0.0 /100 | #333 | Tragic 82.1% |
| Tohono O'odham | 0.0 /100 | #334 | Tragic 82.1% |
| Guatemalans | 0.0 /100 | #335 | Tragic 82.0% |
| Immigrants | Dominican Republic | 0.0 /100 | #336 | Tragic 82.0% |
| Immigrants | Yemen | 0.0 /100 | #337 | Tragic 81.8% |
| Salvadorans | 0.0 /100 | #338 | Tragic 81.7% |
| Pima | 0.0 /100 | #339 | Tragic 81.6% |
| Houma | 0.0 /100 | #340 | Tragic 81.5% |
| Mexicans | 0.0 /100 | #341 | Tragic 81.4% |
| Immigrants | Guatemala | 0.0 /100 | #342 | Tragic 81.4% |
| Immigrants | El Salvador | 0.0 /100 | #343 | Tragic 80.8% |
| Immigrants | Central America | 0.0 /100 | #344 | Tragic 80.1% |
| Yakama | 0.0 /100 | #345 | Tragic 80.0% |
| Spanish American Indians | 0.0 /100 | #346 | Tragic 79.8% |
| Immigrants | Mexico | 0.0 /100 | #347 | Tragic 79.5% |
Demographics Similar to Immigrants from Uruguay by High School Diploma
In terms of high school diploma, the demographic groups most similar to Immigrants from Uruguay are Immigrants from Colombia (87.6%, a difference of 0.010%), Immigrants from South America (87.6%, a difference of 0.050%), Immigrants from Senegal (87.6%, a difference of 0.060%), Ghanaian (87.7%, a difference of 0.11%), and Senegalese (87.7%, a difference of 0.15%).
| Demographics | Rating | Rank | High School Diploma |
| Immigrants | Eritrea | 1.7 /100 | #246 | Tragic 87.8% |
| Immigrants | Costa Rica | 1.7 /100 | #247 | Tragic 87.8% |
| Spanish Americans | 1.5 /100 | #248 | Tragic 87.7% |
| Senegalese | 1.5 /100 | #249 | Tragic 87.7% |
| Immigrants | Nigeria | 1.5 /100 | #250 | Tragic 87.7% |
| Ghanaians | 1.4 /100 | #251 | Tragic 87.7% |
| Immigrants | South America | 1.2 /100 | #252 | Tragic 87.6% |
| Immigrants | Uruguay | 1.0 /100 | #253 | Tragic 87.6% |
| Immigrants | Colombia | 1.0 /100 | #254 | Tragic 87.6% |
| Immigrants | Senegal | 0.9 /100 | #255 | Tragic 87.6% |
| Africans | 0.7 /100 | #256 | Tragic 87.5% |
| Bahamians | 0.7 /100 | #257 | Tragic 87.5% |
| Immigrants | Ghana | 0.5 /100 | #258 | Tragic 87.4% |
| Immigrants | Western Africa | 0.5 /100 | #259 | Tragic 87.4% |
| Cajuns | 0.4 /100 | #260 | Tragic 87.3% |