Liberian vs Lumbee High School Diploma
COMPARE
Liberian
Lumbee
High School Diploma
High School Diploma Comparison
Liberians
Lumbee
88.7%
HIGH SCHOOL DIPLOMA
18.8/ 100
METRIC RATING
198th/ 347
METRIC RANK
83.6%
HIGH SCHOOL DIPLOMA
0.0/ 100
METRIC RATING
322nd/ 347
METRIC RANK
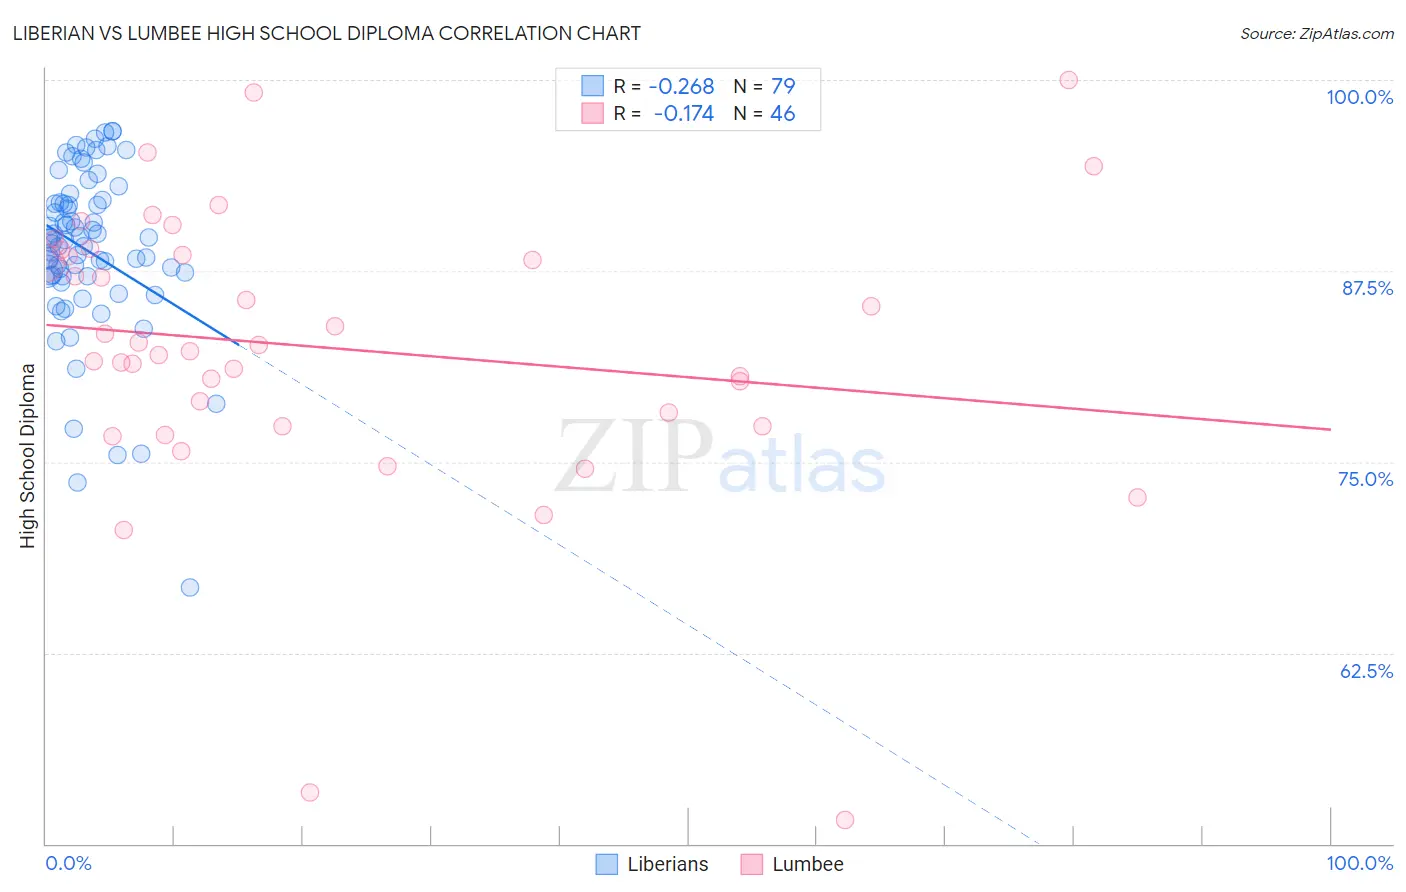
Liberian vs Lumbee High School Diploma Correlation Chart
The statistical analysis conducted on geographies consisting of 118,101,728 people shows a weak negative correlation between the proportion of Liberians and percentage of population with at least high school diploma education in the United States with a correlation coefficient (R) of -0.268 and weighted average of 88.7%. Similarly, the statistical analysis conducted on geographies consisting of 92,299,068 people shows a poor negative correlation between the proportion of Lumbee and percentage of population with at least high school diploma education in the United States with a correlation coefficient (R) of -0.174 and weighted average of 83.6%, a difference of 6.0%.
High School Diploma Correlation Summary
| Measurement | Liberian | Lumbee |
| Minimum | 66.8% | 51.6% |
| Maximum | 96.6% | 100.0% |
| Range | 29.9% | 48.4% |
| Mean | 88.8% | 82.4% |
| Median | 89.5% | 82.4% |
| Interquartile 25% (IQ1) | 87.2% | 77.3% |
| Interquartile 75% (IQ3) | 91.9% | 88.5% |
| Interquartile Range (IQR) | 4.8% | 11.2% |
| Standard Deviation (Sample) | 5.5% | 9.4% |
| Standard Deviation (Population) | 5.5% | 9.3% |
Similar Demographics by High School Diploma
Demographics Similar to Liberians by High School Diploma
In terms of high school diploma, the demographic groups most similar to Liberians are Marshallese (88.6%, a difference of 0.0%), Hawaiian (88.6%, a difference of 0.010%), Korean (88.6%, a difference of 0.020%), Panamanian (88.6%, a difference of 0.020%), and Somali (88.6%, a difference of 0.030%).
| Demographics | Rating | Rank | High School Diploma |
| Immigrants | Ethiopia | 30.9 /100 | #191 | Fair 88.9% |
| Moroccans | 29.5 /100 | #192 | Fair 88.8% |
| Immigrants | Oceania | 26.9 /100 | #193 | Fair 88.8% |
| Immigrants | Venezuela | 25.8 /100 | #194 | Fair 88.8% |
| Afghans | 23.9 /100 | #195 | Fair 88.8% |
| Immigrants | Southern Europe | 23.4 /100 | #196 | Fair 88.7% |
| French American Indians | 21.5 /100 | #197 | Fair 88.7% |
| Liberians | 18.8 /100 | #198 | Poor 88.7% |
| Marshallese | 18.7 /100 | #199 | Poor 88.6% |
| Hawaiians | 18.3 /100 | #200 | Poor 88.6% |
| Koreans | 18.1 /100 | #201 | Poor 88.6% |
| Panamanians | 18.0 /100 | #202 | Poor 88.6% |
| Somalis | 17.5 /100 | #203 | Poor 88.6% |
| Armenians | 17.2 /100 | #204 | Poor 88.6% |
| Immigrants | Micronesia | 16.4 /100 | #205 | Poor 88.6% |
Demographics Similar to Lumbee by High School Diploma
In terms of high school diploma, the demographic groups most similar to Lumbee are Immigrants from Cuba (83.5%, a difference of 0.16%), Yuman (84.0%, a difference of 0.41%), Immigrants from Cabo Verde (83.3%, a difference of 0.45%), Nicaraguan (84.1%, a difference of 0.55%), and Central American Indian (84.2%, a difference of 0.64%).
| Demographics | Rating | Rank | High School Diploma |
| Puerto Ricans | 0.0 /100 | #315 | Tragic 84.7% |
| Belizeans | 0.0 /100 | #316 | Tragic 84.3% |
| Immigrants | Caribbean | 0.0 /100 | #317 | Tragic 84.3% |
| Immigrants | Belize | 0.0 /100 | #318 | Tragic 84.2% |
| Central American Indians | 0.0 /100 | #319 | Tragic 84.2% |
| Nicaraguans | 0.0 /100 | #320 | Tragic 84.1% |
| Yuman | 0.0 /100 | #321 | Tragic 84.0% |
| Lumbee | 0.0 /100 | #322 | Tragic 83.6% |
| Immigrants | Cuba | 0.0 /100 | #323 | Tragic 83.5% |
| Immigrants | Cabo Verde | 0.0 /100 | #324 | Tragic 83.3% |
| Immigrants | Nicaragua | 0.0 /100 | #325 | Tragic 83.1% |
| Mexican American Indians | 0.0 /100 | #326 | Tragic 83.0% |
| Hondurans | 0.0 /100 | #327 | Tragic 83.0% |
| Dominicans | 0.0 /100 | #328 | Tragic 82.9% |
| Hispanics or Latinos | 0.0 /100 | #329 | Tragic 82.9% |