American vs Lumbee High School Diploma
COMPARE
American
Lumbee
High School Diploma
High School Diploma Comparison
Americans
Lumbee
89.1%
HIGH SCHOOL DIPLOMA
47.2/ 100
METRIC RATING
179th/ 347
METRIC RANK
83.6%
HIGH SCHOOL DIPLOMA
0.0/ 100
METRIC RATING
322nd/ 347
METRIC RANK
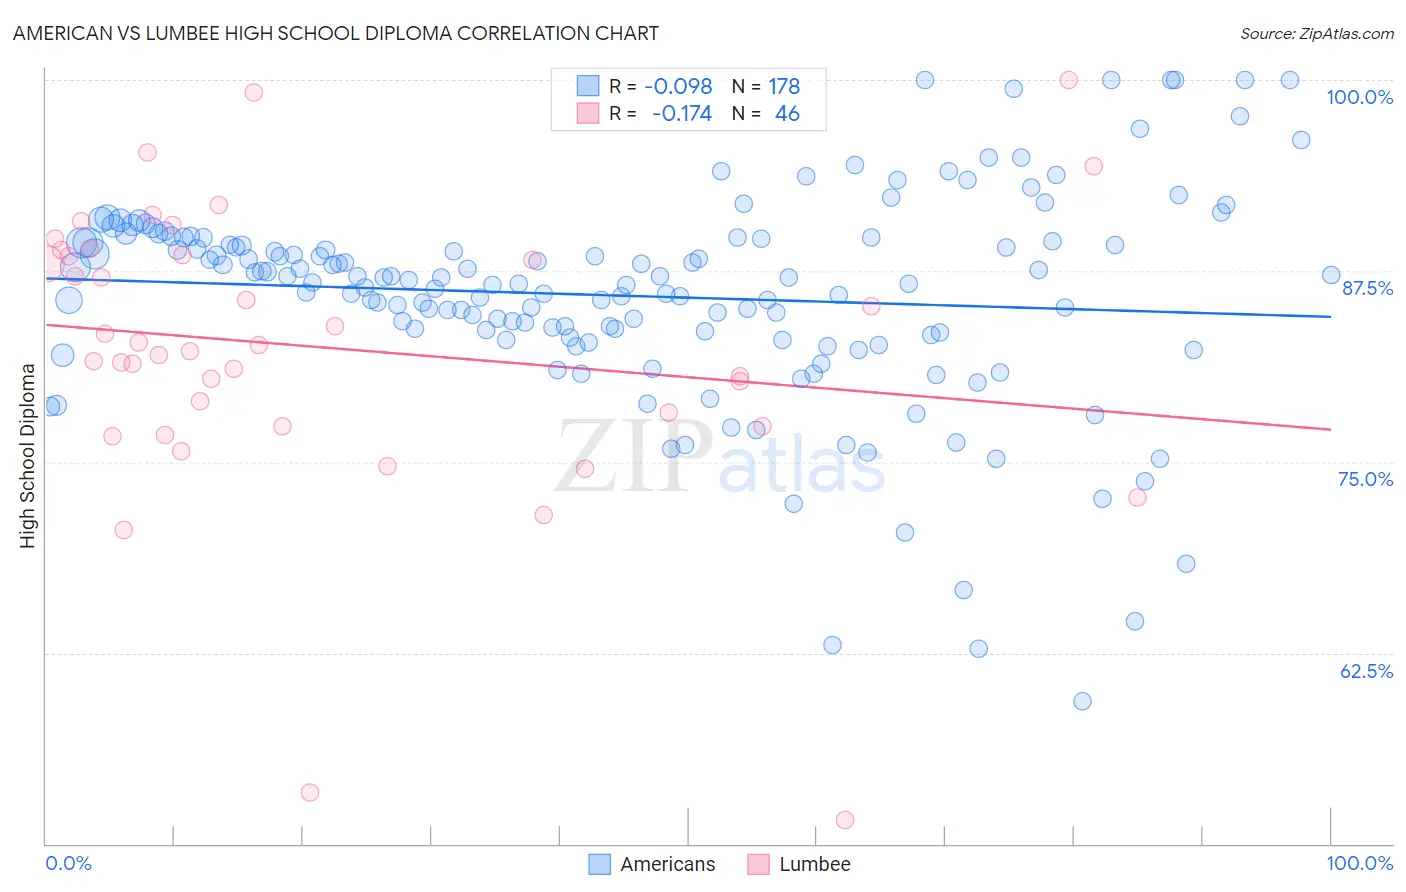
American vs Lumbee High School Diploma Correlation Chart
The statistical analysis conducted on geographies consisting of 581,993,169 people shows a slight negative correlation between the proportion of Americans and percentage of population with at least high school diploma education in the United States with a correlation coefficient (R) of -0.098 and weighted average of 89.1%. Similarly, the statistical analysis conducted on geographies consisting of 92,299,068 people shows a poor negative correlation between the proportion of Lumbee and percentage of population with at least high school diploma education in the United States with a correlation coefficient (R) of -0.174 and weighted average of 83.6%, a difference of 6.5%.
High School Diploma Correlation Summary
| Measurement | American | Lumbee |
| Minimum | 59.3% | 51.6% |
| Maximum | 100.0% | 100.0% |
| Range | 40.7% | 48.4% |
| Mean | 85.9% | 82.4% |
| Median | 86.8% | 82.4% |
| Interquartile 25% (IQ1) | 83.3% | 77.3% |
| Interquartile 75% (IQ3) | 89.4% | 88.5% |
| Interquartile Range (IQR) | 6.1% | 11.2% |
| Standard Deviation (Sample) | 6.9% | 9.4% |
| Standard Deviation (Population) | 6.9% | 9.3% |
Similar Demographics by High School Diploma
Demographics Similar to Americans by High School Diploma
In terms of high school diploma, the demographic groups most similar to Americans are Osage (89.1%, a difference of 0.020%), Sudanese (89.1%, a difference of 0.020%), Sierra Leonean (89.1%, a difference of 0.020%), Immigrants from Western Asia (89.1%, a difference of 0.030%), and Bolivian (89.1%, a difference of 0.030%).
| Demographics | Rating | Rank | High School Diploma |
| Immigrants | Nonimmigrants | 51.8 /100 | #172 | Average 89.2% |
| Immigrants | Indonesia | 50.3 /100 | #173 | Average 89.1% |
| Hmong | 50.0 /100 | #174 | Average 89.1% |
| Immigrants | Western Asia | 49.0 /100 | #175 | Average 89.1% |
| Osage | 48.9 /100 | #176 | Average 89.1% |
| Sudanese | 48.5 /100 | #177 | Average 89.1% |
| Sierra Leoneans | 48.4 /100 | #178 | Average 89.1% |
| Americans | 47.2 /100 | #179 | Average 89.1% |
| Bolivians | 45.2 /100 | #180 | Average 89.1% |
| Venezuelans | 43.6 /100 | #181 | Average 89.1% |
| Spaniards | 43.4 /100 | #182 | Average 89.1% |
| Potawatomi | 42.5 /100 | #183 | Average 89.0% |
| Immigrants | Syria | 39.2 /100 | #184 | Fair 89.0% |
| Ethiopians | 37.0 /100 | #185 | Fair 89.0% |
| Immigrants | Eastern Africa | 35.8 /100 | #186 | Fair 88.9% |
Demographics Similar to Lumbee by High School Diploma
In terms of high school diploma, the demographic groups most similar to Lumbee are Immigrants from Cuba (83.5%, a difference of 0.16%), Yuman (84.0%, a difference of 0.41%), Immigrants from Cabo Verde (83.3%, a difference of 0.45%), Nicaraguan (84.1%, a difference of 0.55%), and Central American Indian (84.2%, a difference of 0.64%).
| Demographics | Rating | Rank | High School Diploma |
| Puerto Ricans | 0.0 /100 | #315 | Tragic 84.7% |
| Belizeans | 0.0 /100 | #316 | Tragic 84.3% |
| Immigrants | Caribbean | 0.0 /100 | #317 | Tragic 84.3% |
| Immigrants | Belize | 0.0 /100 | #318 | Tragic 84.2% |
| Central American Indians | 0.0 /100 | #319 | Tragic 84.2% |
| Nicaraguans | 0.0 /100 | #320 | Tragic 84.1% |
| Yuman | 0.0 /100 | #321 | Tragic 84.0% |
| Lumbee | 0.0 /100 | #322 | Tragic 83.6% |
| Immigrants | Cuba | 0.0 /100 | #323 | Tragic 83.5% |
| Immigrants | Cabo Verde | 0.0 /100 | #324 | Tragic 83.3% |
| Immigrants | Nicaragua | 0.0 /100 | #325 | Tragic 83.1% |
| Mexican American Indians | 0.0 /100 | #326 | Tragic 83.0% |
| Hondurans | 0.0 /100 | #327 | Tragic 83.0% |
| Dominicans | 0.0 /100 | #328 | Tragic 82.9% |
| Hispanics or Latinos | 0.0 /100 | #329 | Tragic 82.9% |