Bhutanese vs Lumbee High School Diploma
COMPARE
Bhutanese
Lumbee
High School Diploma
High School Diploma Comparison
Bhutanese
Lumbee
91.2%
HIGH SCHOOL DIPLOMA
99.8/ 100
METRIC RATING
49th/ 347
METRIC RANK
83.6%
HIGH SCHOOL DIPLOMA
0.0/ 100
METRIC RATING
322nd/ 347
METRIC RANK
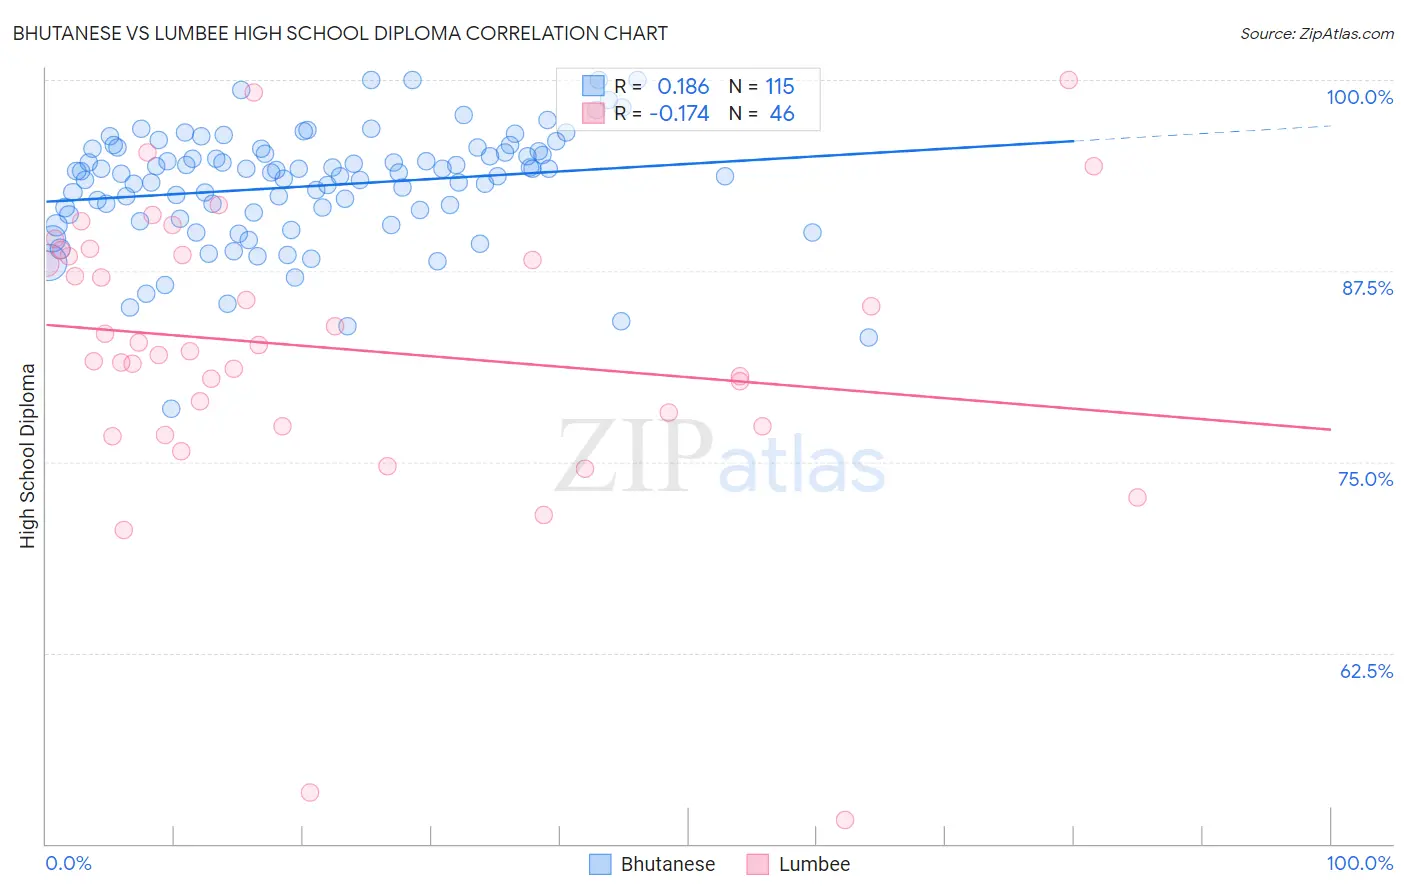
Bhutanese vs Lumbee High School Diploma Correlation Chart
The statistical analysis conducted on geographies consisting of 455,590,907 people shows a poor positive correlation between the proportion of Bhutanese and percentage of population with at least high school diploma education in the United States with a correlation coefficient (R) of 0.186 and weighted average of 91.2%. Similarly, the statistical analysis conducted on geographies consisting of 92,299,068 people shows a poor negative correlation between the proportion of Lumbee and percentage of population with at least high school diploma education in the United States with a correlation coefficient (R) of -0.174 and weighted average of 83.6%, a difference of 9.0%.
High School Diploma Correlation Summary
| Measurement | Bhutanese | Lumbee |
| Minimum | 78.4% | 51.6% |
| Maximum | 100.0% | 100.0% |
| Range | 21.6% | 48.4% |
| Mean | 93.1% | 82.4% |
| Median | 93.9% | 82.4% |
| Interquartile 25% (IQ1) | 91.2% | 77.3% |
| Interquartile 75% (IQ3) | 95.3% | 88.5% |
| Interquartile Range (IQR) | 4.1% | 11.2% |
| Standard Deviation (Sample) | 3.8% | 9.4% |
| Standard Deviation (Population) | 3.7% | 9.3% |
Similar Demographics by High School Diploma
Demographics Similar to Bhutanese by High School Diploma
In terms of high school diploma, the demographic groups most similar to Bhutanese are Australian (91.2%, a difference of 0.010%), Belgian (91.2%, a difference of 0.010%), Greek (91.2%, a difference of 0.020%), Welsh (91.2%, a difference of 0.020%), and Immigrants from Austria (91.3%, a difference of 0.060%).
| Demographics | Rating | Rank | High School Diploma |
| Northern Europeans | 99.8 /100 | #42 | Exceptional 91.3% |
| British | 99.8 /100 | #43 | Exceptional 91.3% |
| Immigrants | Austria | 99.8 /100 | #44 | Exceptional 91.3% |
| Turks | 99.8 /100 | #45 | Exceptional 91.2% |
| Greeks | 99.8 /100 | #46 | Exceptional 91.2% |
| Australians | 99.8 /100 | #47 | Exceptional 91.2% |
| Belgians | 99.8 /100 | #48 | Exceptional 91.2% |
| Bhutanese | 99.8 /100 | #49 | Exceptional 91.2% |
| Welsh | 99.8 /100 | #50 | Exceptional 91.2% |
| New Zealanders | 99.7 /100 | #51 | Exceptional 91.1% |
| Immigrants | Sweden | 99.7 /100 | #52 | Exceptional 91.1% |
| Immigrants | Belgium | 99.7 /100 | #53 | Exceptional 91.1% |
| Macedonians | 99.7 /100 | #54 | Exceptional 91.1% |
| Serbians | 99.7 /100 | #55 | Exceptional 91.1% |
| Immigrants | Canada | 99.7 /100 | #56 | Exceptional 91.1% |
Demographics Similar to Lumbee by High School Diploma
In terms of high school diploma, the demographic groups most similar to Lumbee are Immigrants from Cuba (83.5%, a difference of 0.16%), Yuman (84.0%, a difference of 0.41%), Immigrants from Cabo Verde (83.3%, a difference of 0.45%), Nicaraguan (84.1%, a difference of 0.55%), and Central American Indian (84.2%, a difference of 0.64%).
| Demographics | Rating | Rank | High School Diploma |
| Puerto Ricans | 0.0 /100 | #315 | Tragic 84.7% |
| Belizeans | 0.0 /100 | #316 | Tragic 84.3% |
| Immigrants | Caribbean | 0.0 /100 | #317 | Tragic 84.3% |
| Immigrants | Belize | 0.0 /100 | #318 | Tragic 84.2% |
| Central American Indians | 0.0 /100 | #319 | Tragic 84.2% |
| Nicaraguans | 0.0 /100 | #320 | Tragic 84.1% |
| Yuman | 0.0 /100 | #321 | Tragic 84.0% |
| Lumbee | 0.0 /100 | #322 | Tragic 83.6% |
| Immigrants | Cuba | 0.0 /100 | #323 | Tragic 83.5% |
| Immigrants | Cabo Verde | 0.0 /100 | #324 | Tragic 83.3% |
| Immigrants | Nicaragua | 0.0 /100 | #325 | Tragic 83.1% |
| Mexican American Indians | 0.0 /100 | #326 | Tragic 83.0% |
| Hondurans | 0.0 /100 | #327 | Tragic 83.0% |
| Dominicans | 0.0 /100 | #328 | Tragic 82.9% |
| Hispanics or Latinos | 0.0 /100 | #329 | Tragic 82.9% |