Houma vs Immigrants from Laos High School Diploma
COMPARE
Houma
Immigrants from Laos
High School Diploma
High School Diploma Comparison
Houma
Immigrants from Laos
81.5%
HIGH SCHOOL DIPLOMA
0.0/ 100
METRIC RATING
340th/ 347
METRIC RANK
86.6%
HIGH SCHOOL DIPLOMA
0.0/ 100
METRIC RATING
279th/ 347
METRIC RANK
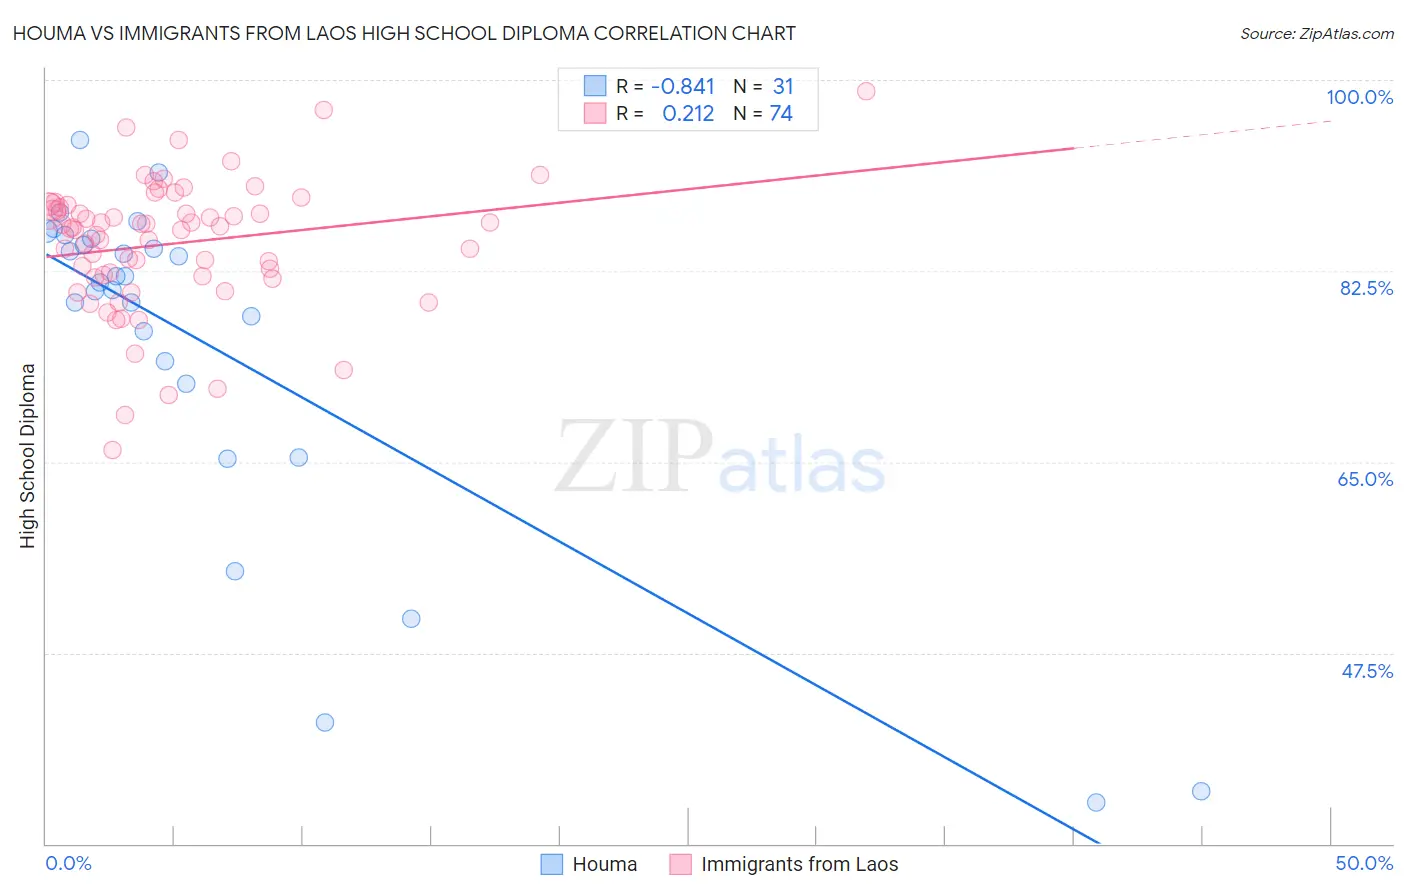
Houma vs Immigrants from Laos High School Diploma Correlation Chart
The statistical analysis conducted on geographies consisting of 36,795,916 people shows a very strong negative correlation between the proportion of Houma and percentage of population with at least high school diploma education in the United States with a correlation coefficient (R) of -0.841 and weighted average of 81.5%. Similarly, the statistical analysis conducted on geographies consisting of 201,472,886 people shows a weak positive correlation between the proportion of Immigrants from Laos and percentage of population with at least high school diploma education in the United States with a correlation coefficient (R) of 0.212 and weighted average of 86.6%, a difference of 6.2%.
High School Diploma Correlation Summary
| Measurement | Houma | Immigrants from Laos |
| Minimum | 33.8% | 66.0% |
| Maximum | 94.5% | 98.9% |
| Range | 60.8% | 32.9% |
| Mean | 75.5% | 85.0% |
| Median | 81.4% | 86.4% |
| Interquartile 25% (IQ1) | 72.2% | 82.0% |
| Interquartile 75% (IQ3) | 85.4% | 88.4% |
| Interquartile Range (IQR) | 13.2% | 6.3% |
| Standard Deviation (Sample) | 16.1% | 6.0% |
| Standard Deviation (Population) | 15.9% | 6.0% |
Similar Demographics by High School Diploma
Demographics Similar to Houma by High School Diploma
In terms of high school diploma, the demographic groups most similar to Houma are Pima (81.6%, a difference of 0.11%), Mexican (81.4%, a difference of 0.15%), Salvadoran (81.7%, a difference of 0.20%), Immigrants from Guatemala (81.4%, a difference of 0.20%), and Immigrants from Yemen (81.8%, a difference of 0.38%).
| Demographics | Rating | Rank | High School Diploma |
| Immigrants | Latin America | 0.0 /100 | #333 | Tragic 82.1% |
| Tohono O'odham | 0.0 /100 | #334 | Tragic 82.1% |
| Guatemalans | 0.0 /100 | #335 | Tragic 82.0% |
| Immigrants | Dominican Republic | 0.0 /100 | #336 | Tragic 82.0% |
| Immigrants | Yemen | 0.0 /100 | #337 | Tragic 81.8% |
| Salvadorans | 0.0 /100 | #338 | Tragic 81.7% |
| Pima | 0.0 /100 | #339 | Tragic 81.6% |
| Houma | 0.0 /100 | #340 | Tragic 81.5% |
| Mexicans | 0.0 /100 | #341 | Tragic 81.4% |
| Immigrants | Guatemala | 0.0 /100 | #342 | Tragic 81.4% |
| Immigrants | El Salvador | 0.0 /100 | #343 | Tragic 80.8% |
| Immigrants | Central America | 0.0 /100 | #344 | Tragic 80.1% |
| Yakama | 0.0 /100 | #345 | Tragic 80.0% |
| Spanish American Indians | 0.0 /100 | #346 | Tragic 79.8% |
| Immigrants | Mexico | 0.0 /100 | #347 | Tragic 79.5% |
Demographics Similar to Immigrants from Laos by High School Diploma
In terms of high school diploma, the demographic groups most similar to Immigrants from Laos are Pueblo (86.5%, a difference of 0.020%), Hopi (86.6%, a difference of 0.050%), Indonesian (86.5%, a difference of 0.070%), Dutch West Indian (86.5%, a difference of 0.11%), and Barbadian (86.7%, a difference of 0.15%).
| Demographics | Rating | Rank | High School Diploma |
| Trinidadians and Tobagonians | 0.1 /100 | #272 | Tragic 86.9% |
| Immigrants | Jamaica | 0.1 /100 | #273 | Tragic 86.9% |
| Bangladeshis | 0.1 /100 | #274 | Tragic 86.9% |
| Immigrants | Trinidad and Tobago | 0.1 /100 | #275 | Tragic 86.8% |
| Immigrants | Burma/Myanmar | 0.1 /100 | #276 | Tragic 86.7% |
| Barbadians | 0.1 /100 | #277 | Tragic 86.7% |
| Hopi | 0.1 /100 | #278 | Tragic 86.6% |
| Immigrants | Laos | 0.0 /100 | #279 | Tragic 86.6% |
| Pueblo | 0.0 /100 | #280 | Tragic 86.5% |
| Indonesians | 0.0 /100 | #281 | Tragic 86.5% |
| Dutch West Indians | 0.0 /100 | #282 | Tragic 86.5% |
| Immigrants | Barbados | 0.0 /100 | #283 | Tragic 86.4% |
| Paiute | 0.0 /100 | #284 | Tragic 86.4% |
| Immigrants | West Indies | 0.0 /100 | #285 | Tragic 86.2% |
| Immigrants | St. Vincent and the Grenadines | 0.0 /100 | #286 | Tragic 86.2% |