African vs Lumbee High School Diploma
COMPARE
African
Lumbee
High School Diploma
High School Diploma Comparison
Africans
Lumbee
87.5%
HIGH SCHOOL DIPLOMA
0.7/ 100
METRIC RATING
256th/ 347
METRIC RANK
83.6%
HIGH SCHOOL DIPLOMA
0.0/ 100
METRIC RATING
322nd/ 347
METRIC RANK
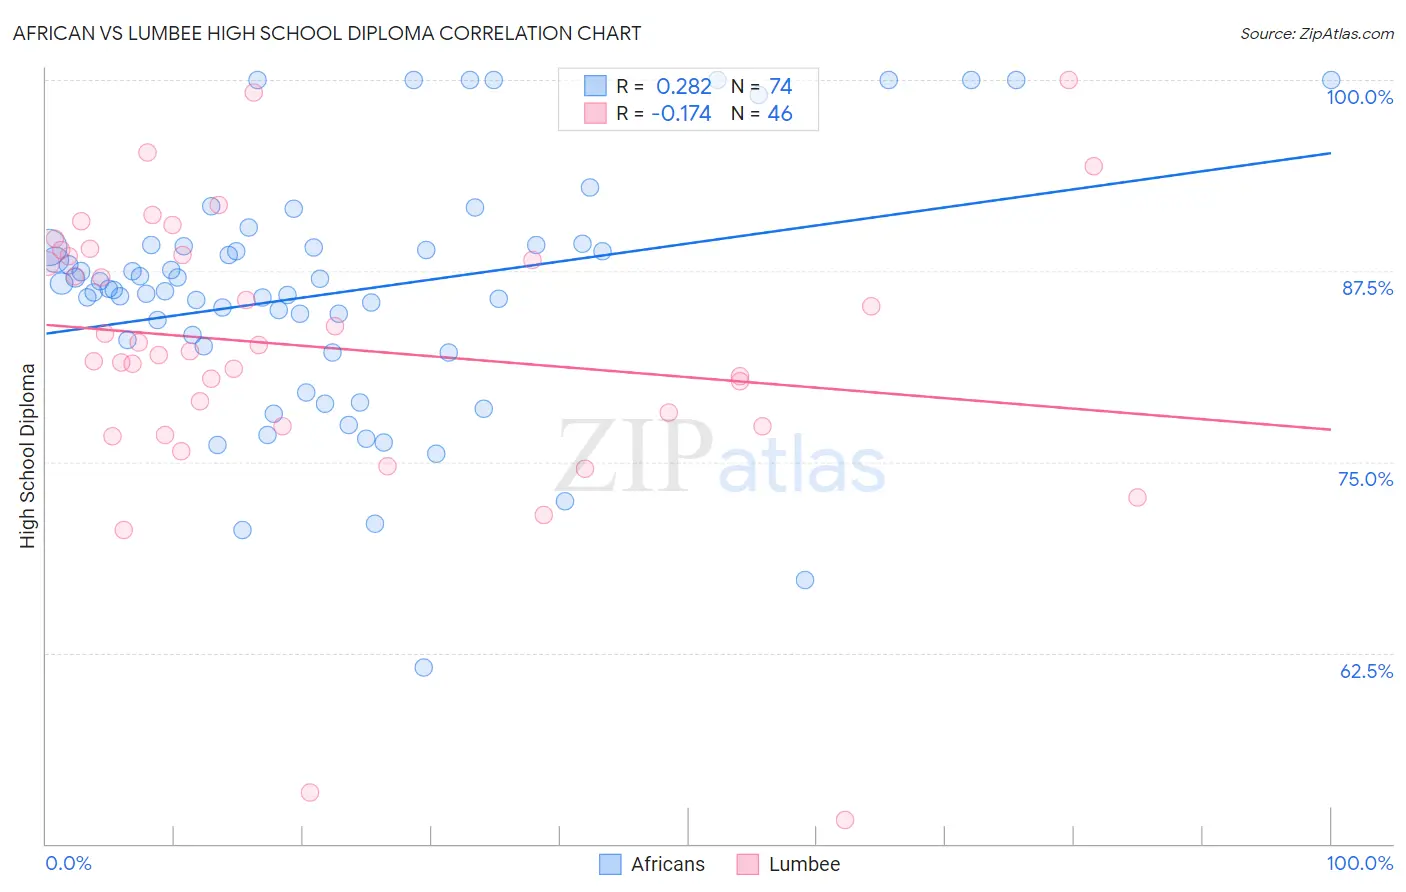
African vs Lumbee High School Diploma Correlation Chart
The statistical analysis conducted on geographies consisting of 470,094,658 people shows a weak positive correlation between the proportion of Africans and percentage of population with at least high school diploma education in the United States with a correlation coefficient (R) of 0.282 and weighted average of 87.5%. Similarly, the statistical analysis conducted on geographies consisting of 92,299,068 people shows a poor negative correlation between the proportion of Lumbee and percentage of population with at least high school diploma education in the United States with a correlation coefficient (R) of -0.174 and weighted average of 83.6%, a difference of 4.6%.
High School Diploma Correlation Summary
| Measurement | African | Lumbee |
| Minimum | 61.5% | 51.6% |
| Maximum | 100.0% | 100.0% |
| Range | 38.5% | 48.4% |
| Mean | 86.1% | 82.4% |
| Median | 86.3% | 82.4% |
| Interquartile 25% (IQ1) | 82.6% | 77.3% |
| Interquartile 75% (IQ3) | 89.1% | 88.5% |
| Interquartile Range (IQR) | 6.5% | 11.2% |
| Standard Deviation (Sample) | 8.0% | 9.4% |
| Standard Deviation (Population) | 8.0% | 9.3% |
Similar Demographics by High School Diploma
Demographics Similar to Africans by High School Diploma
In terms of high school diploma, the demographic groups most similar to Africans are Bahamian (87.5%, a difference of 0.0%), Immigrants from Senegal (87.6%, a difference of 0.10%), Immigrants from Ghana (87.4%, a difference of 0.11%), Immigrants from Western Africa (87.4%, a difference of 0.12%), and Immigrants from Uruguay (87.6%, a difference of 0.16%).
| Demographics | Rating | Rank | High School Diploma |
| Senegalese | 1.5 /100 | #249 | Tragic 87.7% |
| Immigrants | Nigeria | 1.5 /100 | #250 | Tragic 87.7% |
| Ghanaians | 1.4 /100 | #251 | Tragic 87.7% |
| Immigrants | South America | 1.2 /100 | #252 | Tragic 87.6% |
| Immigrants | Uruguay | 1.0 /100 | #253 | Tragic 87.6% |
| Immigrants | Colombia | 1.0 /100 | #254 | Tragic 87.6% |
| Immigrants | Senegal | 0.9 /100 | #255 | Tragic 87.6% |
| Africans | 0.7 /100 | #256 | Tragic 87.5% |
| Bahamians | 0.7 /100 | #257 | Tragic 87.5% |
| Immigrants | Ghana | 0.5 /100 | #258 | Tragic 87.4% |
| Immigrants | Western Africa | 0.5 /100 | #259 | Tragic 87.4% |
| Cajuns | 0.4 /100 | #260 | Tragic 87.3% |
| Seminole | 0.4 /100 | #261 | Tragic 87.3% |
| Immigrants | Peru | 0.4 /100 | #262 | Tragic 87.3% |
| Immigrants | South Eastern Asia | 0.3 /100 | #263 | Tragic 87.2% |
Demographics Similar to Lumbee by High School Diploma
In terms of high school diploma, the demographic groups most similar to Lumbee are Immigrants from Cuba (83.5%, a difference of 0.16%), Yuman (84.0%, a difference of 0.41%), Immigrants from Cabo Verde (83.3%, a difference of 0.45%), Nicaraguan (84.1%, a difference of 0.55%), and Central American Indian (84.2%, a difference of 0.64%).
| Demographics | Rating | Rank | High School Diploma |
| Puerto Ricans | 0.0 /100 | #315 | Tragic 84.7% |
| Belizeans | 0.0 /100 | #316 | Tragic 84.3% |
| Immigrants | Caribbean | 0.0 /100 | #317 | Tragic 84.3% |
| Immigrants | Belize | 0.0 /100 | #318 | Tragic 84.2% |
| Central American Indians | 0.0 /100 | #319 | Tragic 84.2% |
| Nicaraguans | 0.0 /100 | #320 | Tragic 84.1% |
| Yuman | 0.0 /100 | #321 | Tragic 84.0% |
| Lumbee | 0.0 /100 | #322 | Tragic 83.6% |
| Immigrants | Cuba | 0.0 /100 | #323 | Tragic 83.5% |
| Immigrants | Cabo Verde | 0.0 /100 | #324 | Tragic 83.3% |
| Immigrants | Nicaragua | 0.0 /100 | #325 | Tragic 83.1% |
| Mexican American Indians | 0.0 /100 | #326 | Tragic 83.0% |
| Hondurans | 0.0 /100 | #327 | Tragic 83.0% |
| Dominicans | 0.0 /100 | #328 | Tragic 82.9% |
| Hispanics or Latinos | 0.0 /100 | #329 | Tragic 82.9% |