Iranian vs Lumbee High School Diploma
COMPARE
Iranian
Lumbee
High School Diploma
High School Diploma Comparison
Iranians
Lumbee
91.4%
HIGH SCHOOL DIPLOMA
99.9/ 100
METRIC RATING
30th/ 347
METRIC RANK
83.6%
HIGH SCHOOL DIPLOMA
0.0/ 100
METRIC RATING
322nd/ 347
METRIC RANK
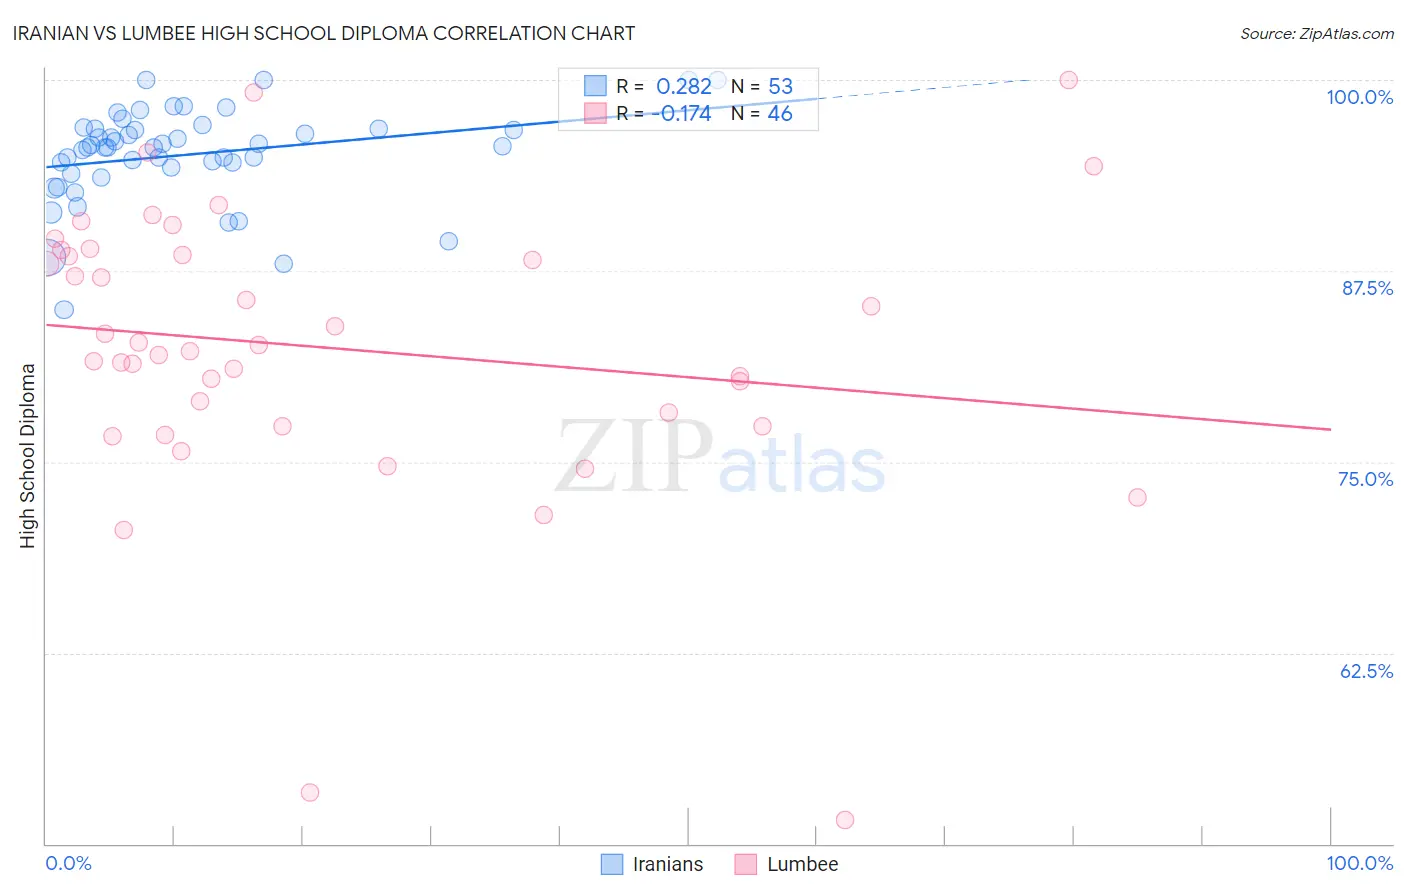
Iranian vs Lumbee High School Diploma Correlation Chart
The statistical analysis conducted on geographies consisting of 316,901,778 people shows a weak positive correlation between the proportion of Iranians and percentage of population with at least high school diploma education in the United States with a correlation coefficient (R) of 0.282 and weighted average of 91.4%. Similarly, the statistical analysis conducted on geographies consisting of 92,299,068 people shows a poor negative correlation between the proportion of Lumbee and percentage of population with at least high school diploma education in the United States with a correlation coefficient (R) of -0.174 and weighted average of 83.6%, a difference of 9.3%.
High School Diploma Correlation Summary
| Measurement | Iranian | Lumbee |
| Minimum | 85.0% | 51.6% |
| Maximum | 100.0% | 100.0% |
| Range | 15.0% | 48.4% |
| Mean | 95.1% | 82.4% |
| Median | 95.6% | 82.4% |
| Interquartile 25% (IQ1) | 94.1% | 77.3% |
| Interquartile 75% (IQ3) | 96.8% | 88.5% |
| Interquartile Range (IQR) | 2.7% | 11.2% |
| Standard Deviation (Sample) | 3.1% | 9.4% |
| Standard Deviation (Population) | 3.0% | 9.3% |
Similar Demographics by High School Diploma
Demographics Similar to Iranians by High School Diploma
In terms of high school diploma, the demographic groups most similar to Iranians are European (91.4%, a difference of 0.010%), Immigrants from Northern Europe (91.4%, a difference of 0.010%), English (91.4%, a difference of 0.010%), Okinawan (91.4%, a difference of 0.010%), and Scottish (91.4%, a difference of 0.020%).
| Demographics | Rating | Rank | High School Diploma |
| Scandinavians | 99.9 /100 | #23 | Exceptional 91.5% |
| Italians | 99.9 /100 | #24 | Exceptional 91.5% |
| Thais | 99.9 /100 | #25 | Exceptional 91.5% |
| Russians | 99.9 /100 | #26 | Exceptional 91.5% |
| Cypriots | 99.9 /100 | #27 | Exceptional 91.5% |
| Tlingit-Haida | 99.9 /100 | #28 | Exceptional 91.4% |
| Europeans | 99.9 /100 | #29 | Exceptional 91.4% |
| Iranians | 99.9 /100 | #30 | Exceptional 91.4% |
| Immigrants | Northern Europe | 99.9 /100 | #31 | Exceptional 91.4% |
| English | 99.9 /100 | #32 | Exceptional 91.4% |
| Okinawans | 99.9 /100 | #33 | Exceptional 91.4% |
| Scottish | 99.9 /100 | #34 | Exceptional 91.4% |
| Irish | 99.9 /100 | #35 | Exceptional 91.4% |
| Tsimshian | 99.9 /100 | #36 | Exceptional 91.3% |
| Immigrants | Ireland | 99.9 /100 | #37 | Exceptional 91.3% |
Demographics Similar to Lumbee by High School Diploma
In terms of high school diploma, the demographic groups most similar to Lumbee are Immigrants from Cuba (83.5%, a difference of 0.16%), Yuman (84.0%, a difference of 0.41%), Immigrants from Cabo Verde (83.3%, a difference of 0.45%), Nicaraguan (84.1%, a difference of 0.55%), and Central American Indian (84.2%, a difference of 0.64%).
| Demographics | Rating | Rank | High School Diploma |
| Puerto Ricans | 0.0 /100 | #315 | Tragic 84.7% |
| Belizeans | 0.0 /100 | #316 | Tragic 84.3% |
| Immigrants | Caribbean | 0.0 /100 | #317 | Tragic 84.3% |
| Immigrants | Belize | 0.0 /100 | #318 | Tragic 84.2% |
| Central American Indians | 0.0 /100 | #319 | Tragic 84.2% |
| Nicaraguans | 0.0 /100 | #320 | Tragic 84.1% |
| Yuman | 0.0 /100 | #321 | Tragic 84.0% |
| Lumbee | 0.0 /100 | #322 | Tragic 83.6% |
| Immigrants | Cuba | 0.0 /100 | #323 | Tragic 83.5% |
| Immigrants | Cabo Verde | 0.0 /100 | #324 | Tragic 83.3% |
| Immigrants | Nicaragua | 0.0 /100 | #325 | Tragic 83.1% |
| Mexican American Indians | 0.0 /100 | #326 | Tragic 83.0% |
| Hondurans | 0.0 /100 | #327 | Tragic 83.0% |
| Dominicans | 0.0 /100 | #328 | Tragic 82.9% |
| Hispanics or Latinos | 0.0 /100 | #329 | Tragic 82.9% |