Houma vs Immigrants from Uganda High School Diploma
COMPARE
Houma
Immigrants from Uganda
High School Diploma
High School Diploma Comparison
Houma
Immigrants from Uganda
81.5%
HIGH SCHOOL DIPLOMA
0.0/ 100
METRIC RATING
340th/ 347
METRIC RANK
88.9%
HIGH SCHOOL DIPLOMA
32.6/ 100
METRIC RATING
189th/ 347
METRIC RANK
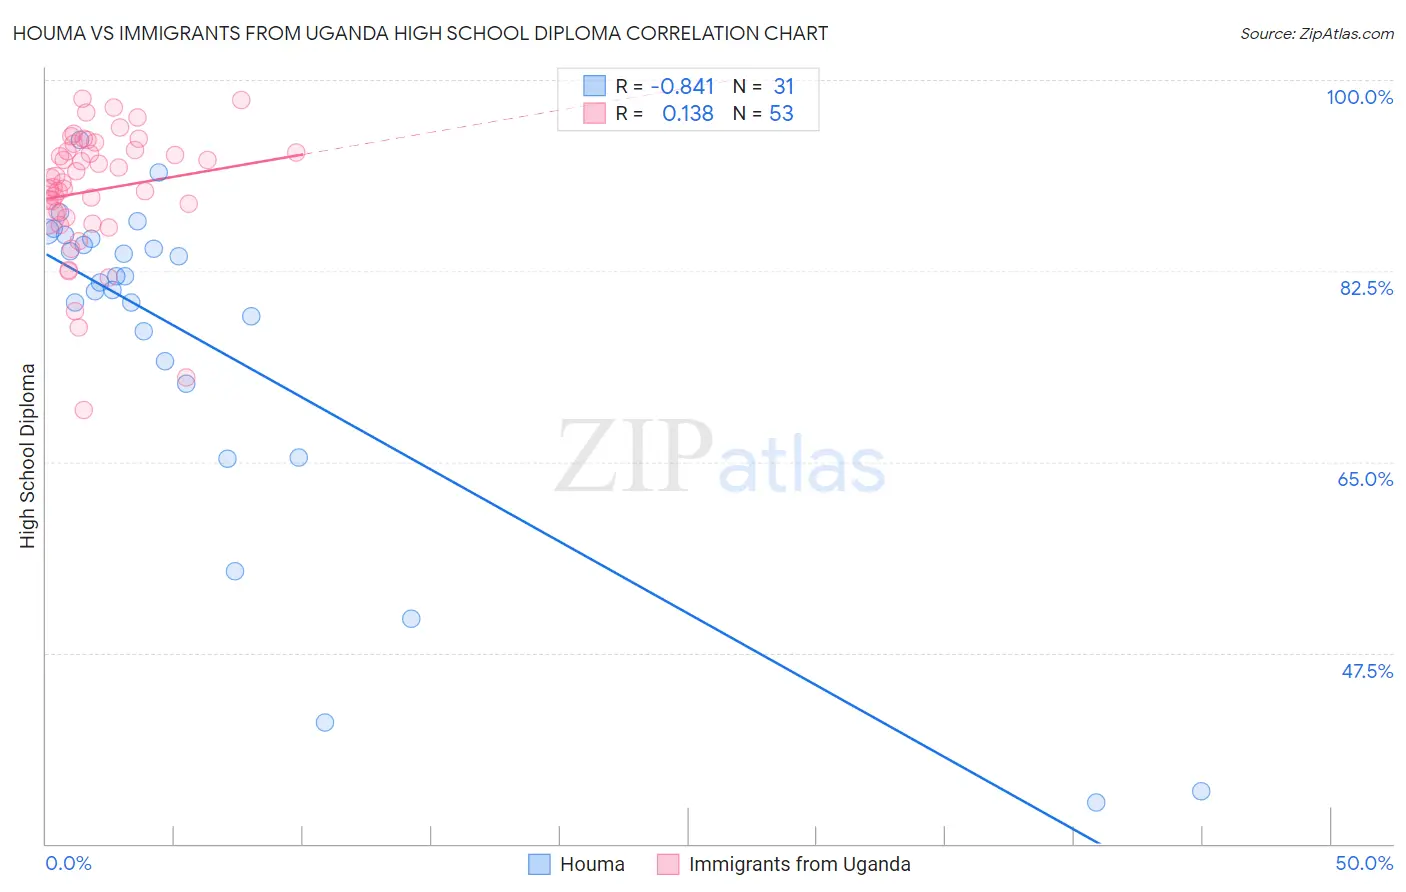
Houma vs Immigrants from Uganda High School Diploma Correlation Chart
The statistical analysis conducted on geographies consisting of 36,795,916 people shows a very strong negative correlation between the proportion of Houma and percentage of population with at least high school diploma education in the United States with a correlation coefficient (R) of -0.841 and weighted average of 81.5%. Similarly, the statistical analysis conducted on geographies consisting of 125,981,524 people shows a poor positive correlation between the proportion of Immigrants from Uganda and percentage of population with at least high school diploma education in the United States with a correlation coefficient (R) of 0.138 and weighted average of 88.9%, a difference of 9.0%.
High School Diploma Correlation Summary
| Measurement | Houma | Immigrants from Uganda |
| Minimum | 33.8% | 69.8% |
| Maximum | 94.5% | 98.3% |
| Range | 60.8% | 28.5% |
| Mean | 75.5% | 89.9% |
| Median | 81.4% | 91.0% |
| Interquartile 25% (IQ1) | 72.2% | 87.4% |
| Interquartile 75% (IQ3) | 85.4% | 93.9% |
| Interquartile Range (IQR) | 13.2% | 6.5% |
| Standard Deviation (Sample) | 16.1% | 6.0% |
| Standard Deviation (Population) | 15.9% | 5.9% |
Similar Demographics by High School Diploma
Demographics Similar to Houma by High School Diploma
In terms of high school diploma, the demographic groups most similar to Houma are Pima (81.6%, a difference of 0.11%), Mexican (81.4%, a difference of 0.15%), Salvadoran (81.7%, a difference of 0.20%), Immigrants from Guatemala (81.4%, a difference of 0.20%), and Immigrants from Yemen (81.8%, a difference of 0.38%).
| Demographics | Rating | Rank | High School Diploma |
| Immigrants | Latin America | 0.0 /100 | #333 | Tragic 82.1% |
| Tohono O'odham | 0.0 /100 | #334 | Tragic 82.1% |
| Guatemalans | 0.0 /100 | #335 | Tragic 82.0% |
| Immigrants | Dominican Republic | 0.0 /100 | #336 | Tragic 82.0% |
| Immigrants | Yemen | 0.0 /100 | #337 | Tragic 81.8% |
| Salvadorans | 0.0 /100 | #338 | Tragic 81.7% |
| Pima | 0.0 /100 | #339 | Tragic 81.6% |
| Houma | 0.0 /100 | #340 | Tragic 81.5% |
| Mexicans | 0.0 /100 | #341 | Tragic 81.4% |
| Immigrants | Guatemala | 0.0 /100 | #342 | Tragic 81.4% |
| Immigrants | El Salvador | 0.0 /100 | #343 | Tragic 80.8% |
| Immigrants | Central America | 0.0 /100 | #344 | Tragic 80.1% |
| Yakama | 0.0 /100 | #345 | Tragic 80.0% |
| Spanish American Indians | 0.0 /100 | #346 | Tragic 79.8% |
| Immigrants | Mexico | 0.0 /100 | #347 | Tragic 79.5% |
Demographics Similar to Immigrants from Uganda by High School Diploma
In terms of high school diploma, the demographic groups most similar to Immigrants from Uganda are Immigrants from Sudan (88.9%, a difference of 0.010%), Immigrants from Chile (88.9%, a difference of 0.010%), Immigrants from Ethiopia (88.9%, a difference of 0.030%), Immigrants from Eastern Africa (88.9%, a difference of 0.050%), and Guamanian/Chamorro (88.9%, a difference of 0.050%).
| Demographics | Rating | Rank | High School Diploma |
| Spaniards | 43.4 /100 | #182 | Average 89.1% |
| Potawatomi | 42.5 /100 | #183 | Average 89.0% |
| Immigrants | Syria | 39.2 /100 | #184 | Fair 89.0% |
| Ethiopians | 37.0 /100 | #185 | Fair 89.0% |
| Immigrants | Eastern Africa | 35.8 /100 | #186 | Fair 88.9% |
| Guamanians/Chamorros | 35.5 /100 | #187 | Fair 88.9% |
| Immigrants | Sudan | 33.4 /100 | #188 | Fair 88.9% |
| Immigrants | Uganda | 32.6 /100 | #189 | Fair 88.9% |
| Immigrants | Chile | 31.9 /100 | #190 | Fair 88.9% |
| Immigrants | Ethiopia | 30.9 /100 | #191 | Fair 88.9% |
| Moroccans | 29.5 /100 | #192 | Fair 88.8% |
| Immigrants | Oceania | 26.9 /100 | #193 | Fair 88.8% |
| Immigrants | Venezuela | 25.8 /100 | #194 | Fair 88.8% |
| Afghans | 23.9 /100 | #195 | Fair 88.8% |
| Immigrants | Southern Europe | 23.4 /100 | #196 | Fair 88.7% |