Houma vs Albanian High School Diploma
COMPARE
Houma
Albanian
High School Diploma
High School Diploma Comparison
Houma
Albanians
81.5%
HIGH SCHOOL DIPLOMA
0.0/ 100
METRIC RATING
340th/ 347
METRIC RANK
89.8%
HIGH SCHOOL DIPLOMA
87.2/ 100
METRIC RATING
133rd/ 347
METRIC RANK
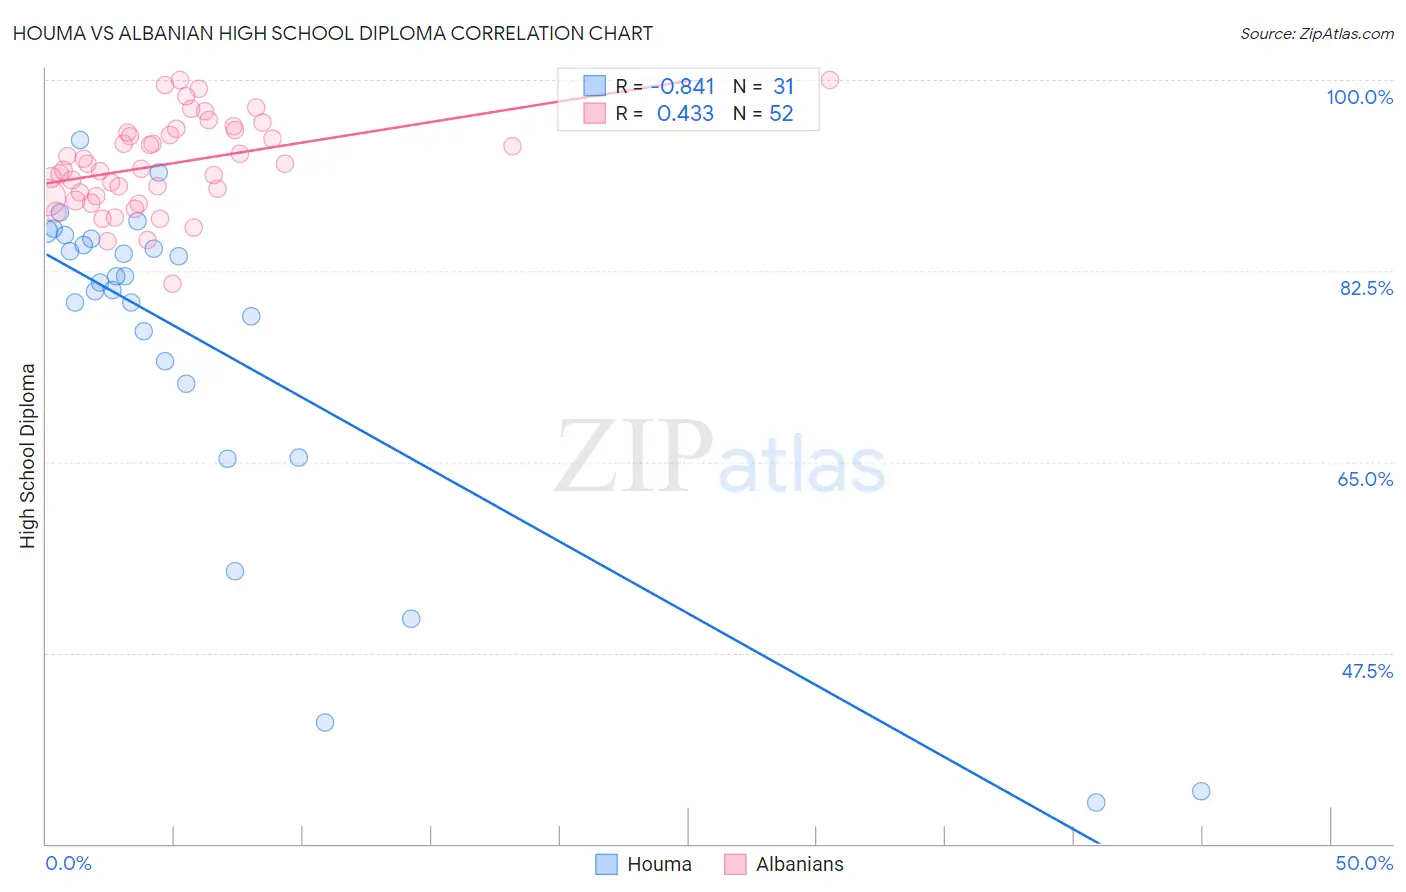
Houma vs Albanian High School Diploma Correlation Chart
The statistical analysis conducted on geographies consisting of 36,795,916 people shows a very strong negative correlation between the proportion of Houma and percentage of population with at least high school diploma education in the United States with a correlation coefficient (R) of -0.841 and weighted average of 81.5%. Similarly, the statistical analysis conducted on geographies consisting of 193,265,850 people shows a moderate positive correlation between the proportion of Albanians and percentage of population with at least high school diploma education in the United States with a correlation coefficient (R) of 0.433 and weighted average of 89.8%, a difference of 10.1%.
High School Diploma Correlation Summary
| Measurement | Houma | Albanian |
| Minimum | 33.8% | 81.3% |
| Maximum | 94.5% | 100.0% |
| Range | 60.8% | 18.7% |
| Mean | 75.5% | 92.3% |
| Median | 81.4% | 92.1% |
| Interquartile 25% (IQ1) | 72.2% | 89.3% |
| Interquartile 75% (IQ3) | 85.4% | 95.3% |
| Interquartile Range (IQR) | 13.2% | 6.0% |
| Standard Deviation (Sample) | 16.1% | 4.2% |
| Standard Deviation (Population) | 15.9% | 4.1% |
Similar Demographics by High School Diploma
Demographics Similar to Houma by High School Diploma
In terms of high school diploma, the demographic groups most similar to Houma are Pima (81.6%, a difference of 0.11%), Mexican (81.4%, a difference of 0.15%), Salvadoran (81.7%, a difference of 0.20%), Immigrants from Guatemala (81.4%, a difference of 0.20%), and Immigrants from Yemen (81.8%, a difference of 0.38%).
| Demographics | Rating | Rank | High School Diploma |
| Immigrants | Latin America | 0.0 /100 | #333 | Tragic 82.1% |
| Tohono O'odham | 0.0 /100 | #334 | Tragic 82.1% |
| Guatemalans | 0.0 /100 | #335 | Tragic 82.0% |
| Immigrants | Dominican Republic | 0.0 /100 | #336 | Tragic 82.0% |
| Immigrants | Yemen | 0.0 /100 | #337 | Tragic 81.8% |
| Salvadorans | 0.0 /100 | #338 | Tragic 81.7% |
| Pima | 0.0 /100 | #339 | Tragic 81.6% |
| Houma | 0.0 /100 | #340 | Tragic 81.5% |
| Mexicans | 0.0 /100 | #341 | Tragic 81.4% |
| Immigrants | Guatemala | 0.0 /100 | #342 | Tragic 81.4% |
| Immigrants | El Salvador | 0.0 /100 | #343 | Tragic 80.8% |
| Immigrants | Central America | 0.0 /100 | #344 | Tragic 80.1% |
| Yakama | 0.0 /100 | #345 | Tragic 80.0% |
| Spanish American Indians | 0.0 /100 | #346 | Tragic 79.8% |
| Immigrants | Mexico | 0.0 /100 | #347 | Tragic 79.5% |
Demographics Similar to Albanians by High School Diploma
In terms of high school diploma, the demographic groups most similar to Albanians are Immigrants from Bosnia and Herzegovina (89.8%, a difference of 0.0%), Immigrants from Jordan (89.8%, a difference of 0.0%), Immigrants from Italy (89.8%, a difference of 0.010%), Immigrants from Ukraine (89.8%, a difference of 0.020%), and Basque (89.8%, a difference of 0.040%).
| Demographics | Rating | Rank | High School Diploma |
| Alaska Natives | 91.0 /100 | #126 | Exceptional 89.9% |
| Immigrants | Eastern Asia | 89.2 /100 | #127 | Excellent 89.9% |
| Puget Sound Salish | 89.1 /100 | #128 | Excellent 89.9% |
| Basques | 88.5 /100 | #129 | Excellent 89.8% |
| Immigrants | Ukraine | 87.9 /100 | #130 | Excellent 89.8% |
| Immigrants | Italy | 87.4 /100 | #131 | Excellent 89.8% |
| Immigrants | Bosnia and Herzegovina | 87.3 /100 | #132 | Excellent 89.8% |
| Albanians | 87.2 /100 | #133 | Excellent 89.8% |
| Immigrants | Jordan | 87.2 /100 | #134 | Excellent 89.8% |
| Chippewa | 85.6 /100 | #135 | Excellent 89.7% |
| Ugandans | 83.7 /100 | #136 | Excellent 89.7% |
| Arabs | 83.6 /100 | #137 | Excellent 89.7% |
| Assyrians/Chaldeans/Syriacs | 82.5 /100 | #138 | Excellent 89.7% |
| Kenyans | 81.4 /100 | #139 | Excellent 89.6% |
| Immigrants | Egypt | 81.2 /100 | #140 | Excellent 89.6% |