Houma vs Subsaharan African High School Diploma
COMPARE
Houma
Subsaharan African
High School Diploma
High School Diploma Comparison
Houma
Sub-Saharan Africans
81.5%
HIGH SCHOOL DIPLOMA
0.0/ 100
METRIC RATING
340th/ 347
METRIC RANK
87.9%
HIGH SCHOOL DIPLOMA
2.8/ 100
METRIC RATING
236th/ 347
METRIC RANK
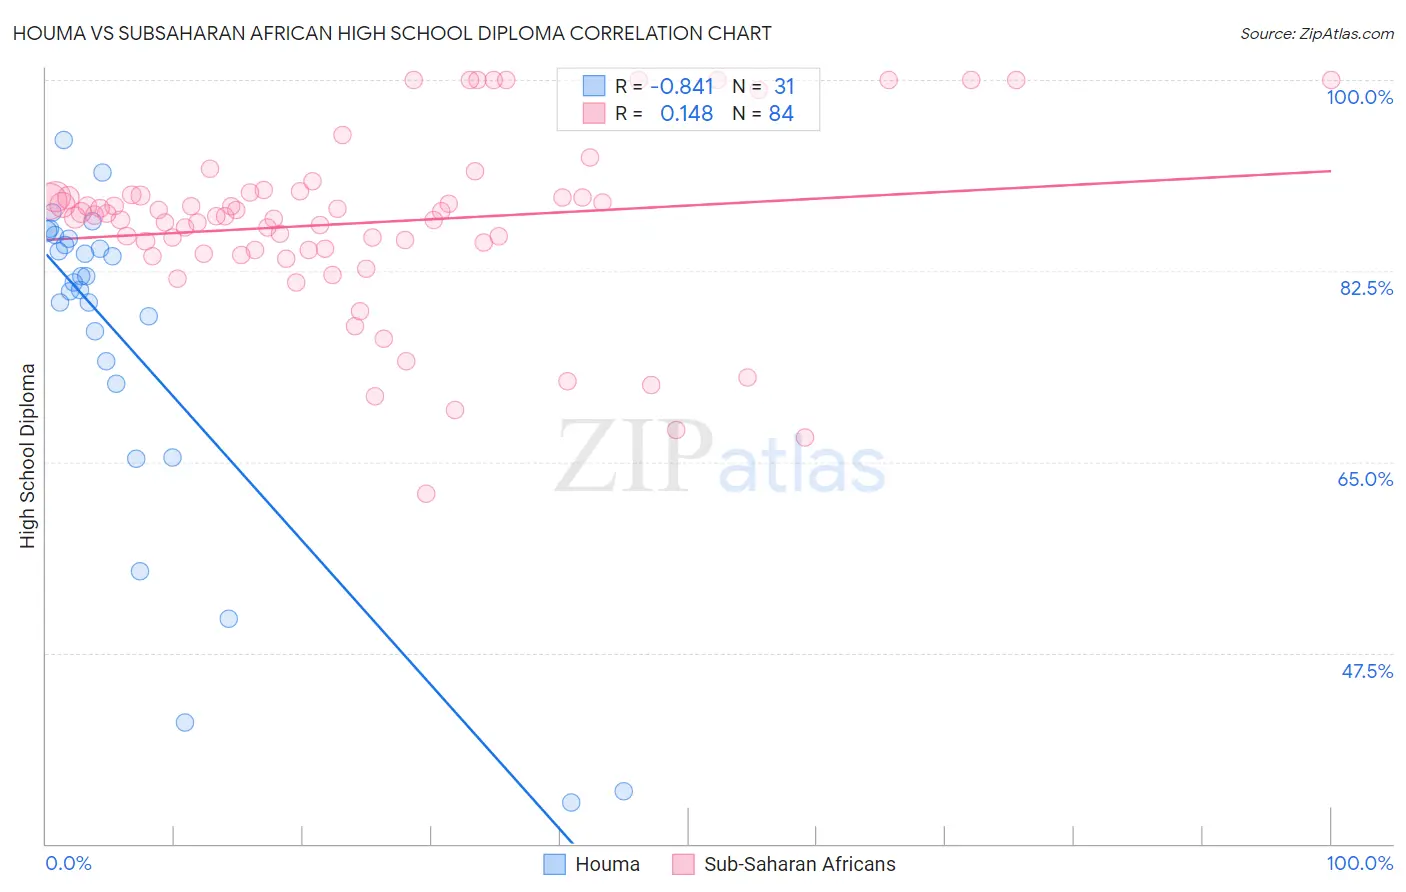
Houma vs Subsaharan African High School Diploma Correlation Chart
The statistical analysis conducted on geographies consisting of 36,795,916 people shows a very strong negative correlation between the proportion of Houma and percentage of population with at least high school diploma education in the United States with a correlation coefficient (R) of -0.841 and weighted average of 81.5%. Similarly, the statistical analysis conducted on geographies consisting of 508,219,008 people shows a poor positive correlation between the proportion of Sub-Saharan Africans and percentage of population with at least high school diploma education in the United States with a correlation coefficient (R) of 0.148 and weighted average of 87.9%, a difference of 7.9%.
High School Diploma Correlation Summary
| Measurement | Houma | Subsaharan African |
| Minimum | 33.8% | 62.1% |
| Maximum | 94.5% | 100.0% |
| Range | 60.8% | 37.9% |
| Mean | 75.5% | 86.9% |
| Median | 81.4% | 87.6% |
| Interquartile 25% (IQ1) | 72.2% | 84.4% |
| Interquartile 75% (IQ3) | 85.4% | 89.4% |
| Interquartile Range (IQR) | 13.2% | 5.0% |
| Standard Deviation (Sample) | 16.1% | 8.1% |
| Standard Deviation (Population) | 15.9% | 8.0% |
Similar Demographics by High School Diploma
Demographics Similar to Houma by High School Diploma
In terms of high school diploma, the demographic groups most similar to Houma are Pima (81.6%, a difference of 0.11%), Mexican (81.4%, a difference of 0.15%), Salvadoran (81.7%, a difference of 0.20%), Immigrants from Guatemala (81.4%, a difference of 0.20%), and Immigrants from Yemen (81.8%, a difference of 0.38%).
| Demographics | Rating | Rank | High School Diploma |
| Immigrants | Latin America | 0.0 /100 | #333 | Tragic 82.1% |
| Tohono O'odham | 0.0 /100 | #334 | Tragic 82.1% |
| Guatemalans | 0.0 /100 | #335 | Tragic 82.0% |
| Immigrants | Dominican Republic | 0.0 /100 | #336 | Tragic 82.0% |
| Immigrants | Yemen | 0.0 /100 | #337 | Tragic 81.8% |
| Salvadorans | 0.0 /100 | #338 | Tragic 81.7% |
| Pima | 0.0 /100 | #339 | Tragic 81.6% |
| Houma | 0.0 /100 | #340 | Tragic 81.5% |
| Mexicans | 0.0 /100 | #341 | Tragic 81.4% |
| Immigrants | Guatemala | 0.0 /100 | #342 | Tragic 81.4% |
| Immigrants | El Salvador | 0.0 /100 | #343 | Tragic 80.8% |
| Immigrants | Central America | 0.0 /100 | #344 | Tragic 80.1% |
| Yakama | 0.0 /100 | #345 | Tragic 80.0% |
| Spanish American Indians | 0.0 /100 | #346 | Tragic 79.8% |
| Immigrants | Mexico | 0.0 /100 | #347 | Tragic 79.5% |
Demographics Similar to Sub-Saharan Africans by High School Diploma
In terms of high school diploma, the demographic groups most similar to Sub-Saharan Africans are Taiwanese (87.9%, a difference of 0.010%), Sioux (87.9%, a difference of 0.010%), South American (87.9%, a difference of 0.010%), Immigrants from Bahamas (88.0%, a difference of 0.020%), and Immigrants from Panama (88.0%, a difference of 0.040%).
| Demographics | Rating | Rank | High School Diploma |
| Nigerians | 5.2 /100 | #229 | Tragic 88.2% |
| Blackfeet | 4.2 /100 | #230 | Tragic 88.1% |
| Colombians | 3.8 /100 | #231 | Tragic 88.1% |
| Immigrants | Middle Africa | 3.4 /100 | #232 | Tragic 88.0% |
| Immigrants | Panama | 3.1 /100 | #233 | Tragic 88.0% |
| Immigrants | Thailand | 3.1 /100 | #234 | Tragic 88.0% |
| Immigrants | Bahamas | 2.9 /100 | #235 | Tragic 88.0% |
| Sub-Saharan Africans | 2.8 /100 | #236 | Tragic 87.9% |
| Taiwanese | 2.8 /100 | #237 | Tragic 87.9% |
| Sioux | 2.7 /100 | #238 | Tragic 87.9% |
| South Americans | 2.7 /100 | #239 | Tragic 87.9% |
| Comanche | 2.2 /100 | #240 | Tragic 87.9% |
| Immigrants | Uzbekistan | 2.1 /100 | #241 | Tragic 87.8% |
| Cheyenne | 2.1 /100 | #242 | Tragic 87.8% |
| Immigrants | Philippines | 1.9 /100 | #243 | Tragic 87.8% |