Finnish vs Immigrants from Vietnam Median Female Earnings
COMPARE
Finnish
Immigrants from Vietnam
Median Female Earnings
Median Female Earnings Comparison
Finns
Immigrants from Vietnam
$38,173
MEDIAN FEMALE EARNINGS
4.0/ 100
METRIC RATING
240th/ 347
METRIC RANK
$40,153
MEDIAN FEMALE EARNINGS
72.0/ 100
METRIC RATING
159th/ 347
METRIC RANK
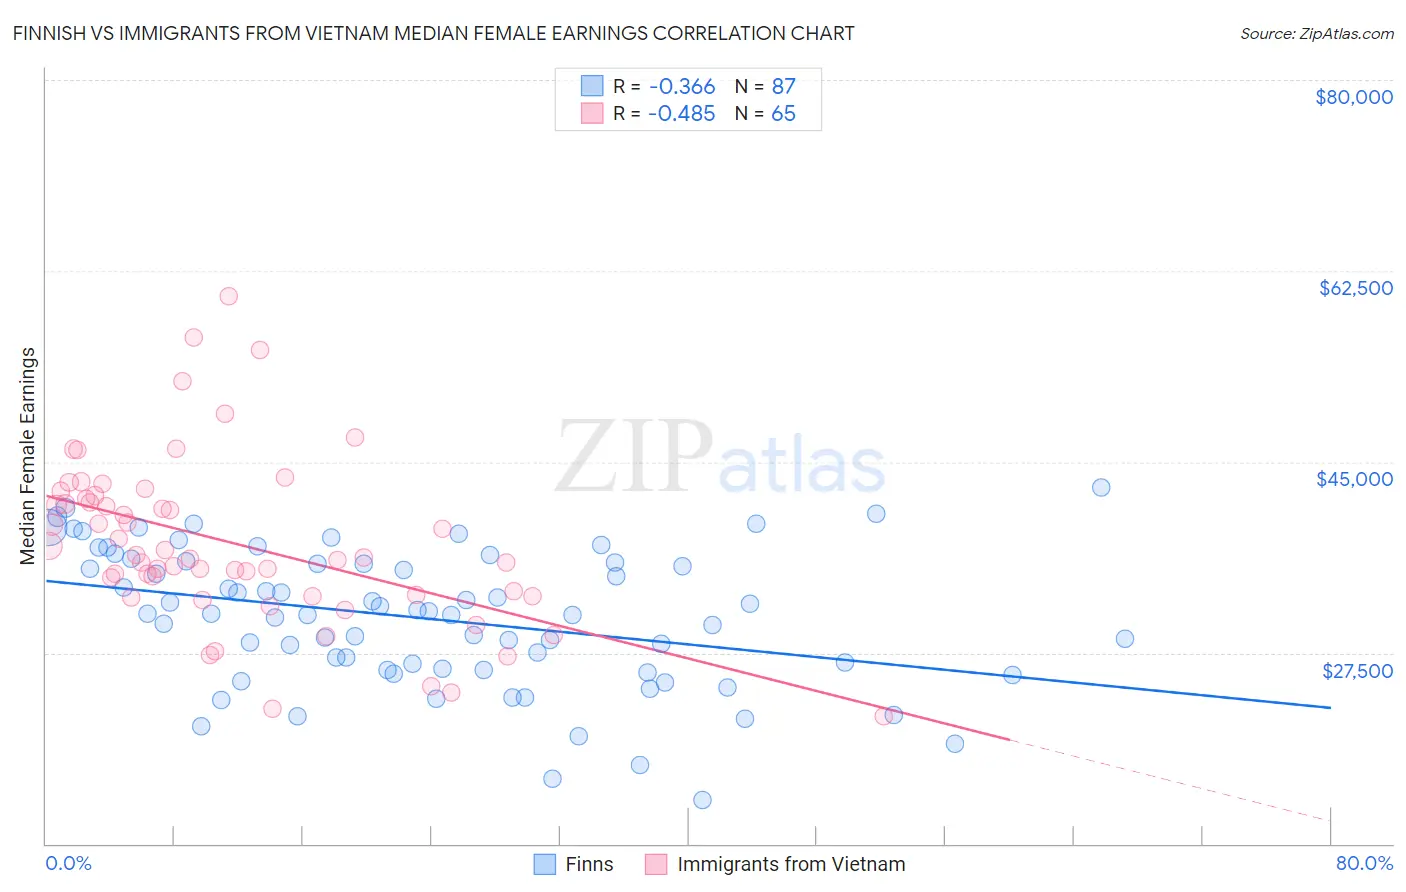
Finnish vs Immigrants from Vietnam Median Female Earnings Correlation Chart
The statistical analysis conducted on geographies consisting of 404,382,146 people shows a mild negative correlation between the proportion of Finns and median female earnings in the United States with a correlation coefficient (R) of -0.366 and weighted average of $38,173. Similarly, the statistical analysis conducted on geographies consisting of 404,736,048 people shows a moderate negative correlation between the proportion of Immigrants from Vietnam and median female earnings in the United States with a correlation coefficient (R) of -0.485 and weighted average of $40,153, a difference of 5.2%.
Median Female Earnings Correlation Summary
| Measurement | Finnish | Immigrants from Vietnam |
| Minimum | $14,000 | $21,667 |
| Maximum | $42,614 | $60,178 |
| Range | $28,614 | $38,511 |
| Mean | $30,656 | $37,583 |
| Median | $31,094 | $36,210 |
| Interquartile 25% (IQ1) | $25,915 | $32,746 |
| Interquartile 75% (IQ3) | $35,736 | $41,762 |
| Interquartile Range (IQR) | $9,822 | $9,017 |
| Standard Deviation (Sample) | $6,298 | $7,711 |
| Standard Deviation (Population) | $6,261 | $7,652 |
Similar Demographics by Median Female Earnings
Demographics Similar to Finns by Median Female Earnings
In terms of median female earnings, the demographic groups most similar to Finns are English ($38,196, a difference of 0.060%), Alaska Native ($38,202, a difference of 0.080%), Immigrants from Cabo Verde ($38,208, a difference of 0.090%), Sudanese ($38,215, a difference of 0.11%), and Liberian ($38,215, a difference of 0.11%).
| Demographics | Rating | Rank | Median Female Earnings |
| Tongans | 5.1 /100 | #233 | Tragic $38,288 |
| Celtics | 5.0 /100 | #234 | Tragic $38,283 |
| Sudanese | 4.4 /100 | #235 | Tragic $38,215 |
| Liberians | 4.4 /100 | #236 | Tragic $38,215 |
| Immigrants | Cabo Verde | 4.3 /100 | #237 | Tragic $38,208 |
| Alaska Natives | 4.3 /100 | #238 | Tragic $38,202 |
| English | 4.2 /100 | #239 | Tragic $38,196 |
| Finns | 4.0 /100 | #240 | Tragic $38,173 |
| Spanish | 3.5 /100 | #241 | Tragic $38,098 |
| Immigrants | Burma/Myanmar | 3.0 /100 | #242 | Tragic $38,028 |
| Germans | 2.8 /100 | #243 | Tragic $37,986 |
| Immigrants | Liberia | 2.7 /100 | #244 | Tragic $37,970 |
| Immigrants | Middle Africa | 2.7 /100 | #245 | Tragic $37,965 |
| Delaware | 2.6 /100 | #246 | Tragic $37,964 |
| Immigrants | Somalia | 2.4 /100 | #247 | Tragic $37,914 |
Demographics Similar to Immigrants from Vietnam by Median Female Earnings
In terms of median female earnings, the demographic groups most similar to Immigrants from Vietnam are Immigrants from Senegal ($40,157, a difference of 0.010%), Portuguese ($40,177, a difference of 0.060%), Inupiat ($40,080, a difference of 0.18%), Peruvian ($40,234, a difference of 0.20%), and Alsatian ($40,060, a difference of 0.23%).
| Demographics | Rating | Rank | Median Female Earnings |
| West Indians | 78.4 /100 | #152 | Good $40,317 |
| British West Indians | 77.7 /100 | #153 | Good $40,299 |
| Immigrants | Oceania | 77.6 /100 | #154 | Good $40,297 |
| Immigrants | Africa | 76.2 /100 | #155 | Good $40,257 |
| Peruvians | 75.3 /100 | #156 | Good $40,234 |
| Portuguese | 73.0 /100 | #157 | Good $40,177 |
| Immigrants | Senegal | 72.2 /100 | #158 | Good $40,157 |
| Immigrants | Vietnam | 72.0 /100 | #159 | Good $40,153 |
| Inupiat | 68.9 /100 | #160 | Good $40,080 |
| Alsatians | 68.0 /100 | #161 | Good $40,060 |
| South American Indians | 66.1 /100 | #162 | Good $40,019 |
| Lebanese | 65.5 /100 | #163 | Good $40,006 |
| Immigrants | Saudi Arabia | 62.9 /100 | #164 | Good $39,952 |
| Immigrants | Bangladesh | 60.8 /100 | #165 | Good $39,910 |
| Immigrants | Ghana | 60.0 /100 | #166 | Good $39,894 |