Finnish vs Immigrants from Vietnam 4 or more Vehicles in Household
COMPARE
Finnish
Immigrants from Vietnam
4 or more Vehicles in Household
4 or more Vehicles in Household Comparison
Finns
Immigrants from Vietnam
7.3%
4 OR MORE VEHICLES IN HOUSEHOLD
99.8/ 100
METRIC RATING
81st/ 347
METRIC RANK
8.6%
4 OR MORE VEHICLES IN HOUSEHOLD
100.0/ 100
METRIC RATING
22nd/ 347
METRIC RANK
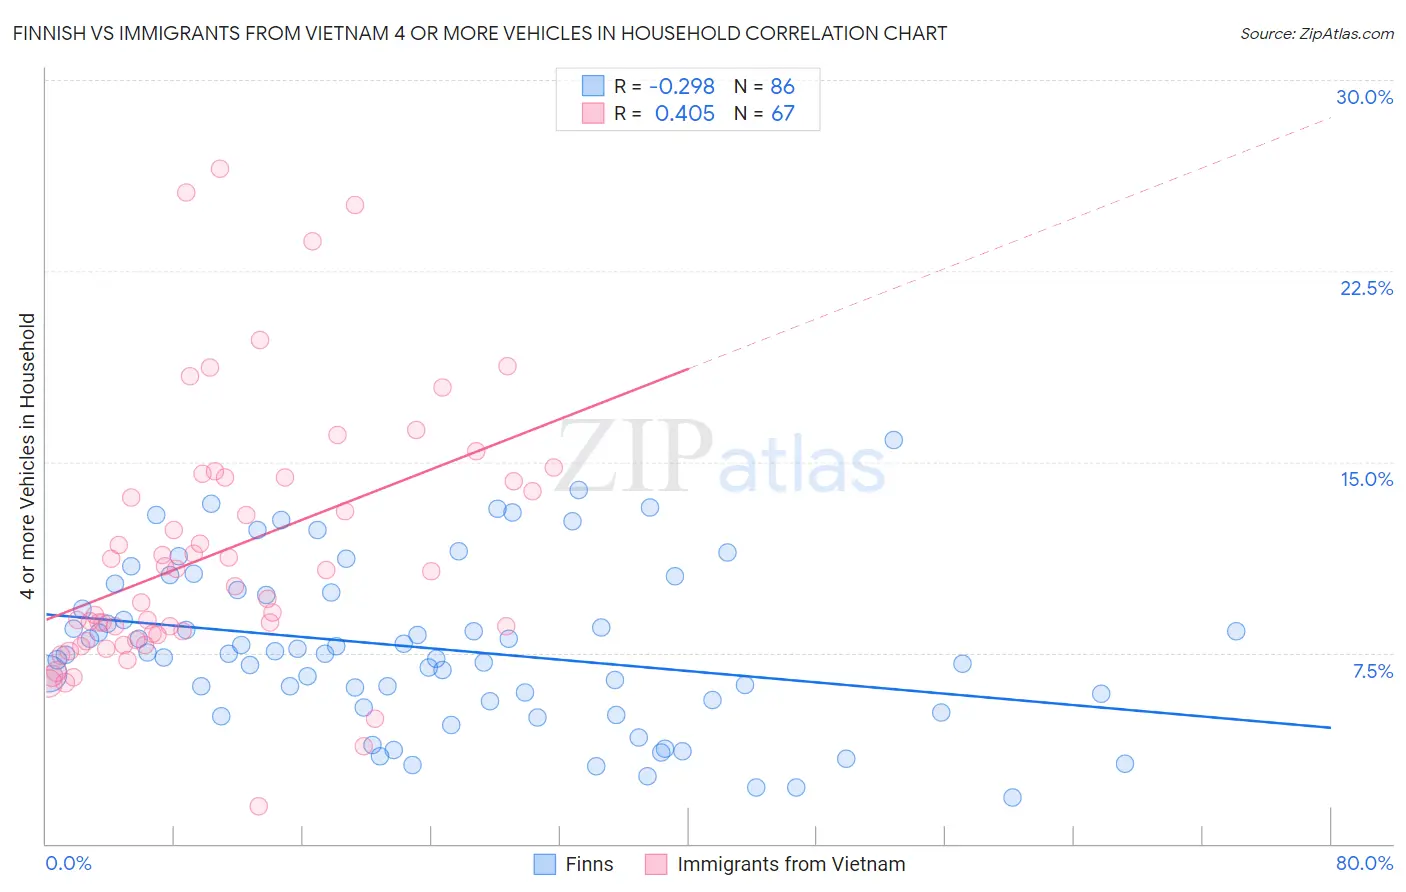
Finnish vs Immigrants from Vietnam 4 or more Vehicles in Household Correlation Chart
The statistical analysis conducted on geographies consisting of 403,293,197 people shows a weak negative correlation between the proportion of Finns and percentage of households with 4 or more vehicles available in the United States with a correlation coefficient (R) of -0.298 and weighted average of 7.3%. Similarly, the statistical analysis conducted on geographies consisting of 403,102,946 people shows a moderate positive correlation between the proportion of Immigrants from Vietnam and percentage of households with 4 or more vehicles available in the United States with a correlation coefficient (R) of 0.405 and weighted average of 8.6%, a difference of 17.4%.
4 or more Vehicles in Household Correlation Summary
| Measurement | Finnish | Immigrants from Vietnam |
| Minimum | 1.8% | 1.5% |
| Maximum | 15.9% | 26.5% |
| Range | 14.0% | 25.0% |
| Mean | 7.7% | 11.5% |
| Median | 7.5% | 10.1% |
| Interquartile 25% (IQ1) | 5.6% | 8.0% |
| Interquartile 75% (IQ3) | 9.9% | 14.4% |
| Interquartile Range (IQR) | 4.3% | 6.4% |
| Standard Deviation (Sample) | 3.2% | 5.1% |
| Standard Deviation (Population) | 3.1% | 5.1% |
Similar Demographics by 4 or more Vehicles in Household
Demographics Similar to Finns by 4 or more Vehicles in Household
In terms of 4 or more vehicles in household, the demographic groups most similar to Finns are Northern European (7.3%, a difference of 0.20%), Potawatomi (7.3%, a difference of 0.32%), Alaska Native (7.3%, a difference of 0.56%), Afghan (7.3%, a difference of 0.65%), and Czech (7.4%, a difference of 0.70%).
| Demographics | Rating | Rank | 4 or more Vehicles in Household |
| Icelanders | 99.9 /100 | #74 | Exceptional 7.4% |
| Immigrants | Cambodia | 99.9 /100 | #75 | Exceptional 7.4% |
| Laotians | 99.9 /100 | #76 | Exceptional 7.4% |
| Apache | 99.9 /100 | #77 | Exceptional 7.4% |
| Whites/Caucasians | 99.8 /100 | #78 | Exceptional 7.4% |
| Czechs | 99.8 /100 | #79 | Exceptional 7.4% |
| Alaska Natives | 99.8 /100 | #80 | Exceptional 7.3% |
| Finns | 99.8 /100 | #81 | Exceptional 7.3% |
| Northern Europeans | 99.8 /100 | #82 | Exceptional 7.3% |
| Potawatomi | 99.7 /100 | #83 | Exceptional 7.3% |
| Afghans | 99.7 /100 | #84 | Exceptional 7.3% |
| Cree | 99.7 /100 | #85 | Exceptional 7.2% |
| Immigrants | Indonesia | 99.6 /100 | #86 | Exceptional 7.2% |
| Delaware | 99.6 /100 | #87 | Exceptional 7.2% |
| Immigrants | Nonimmigrants | 99.6 /100 | #88 | Exceptional 7.2% |
Demographics Similar to Immigrants from Vietnam by 4 or more Vehicles in Household
In terms of 4 or more vehicles in household, the demographic groups most similar to Immigrants from Vietnam are Danish (8.6%, a difference of 0.050%), Pueblo (8.6%, a difference of 0.10%), Immigrants from Philippines (8.5%, a difference of 0.21%), Korean (8.6%, a difference of 0.92%), and Immigrants from Central America (8.5%, a difference of 1.0%).
| Demographics | Rating | Rank | 4 or more Vehicles in Household |
| Shoshone | 100.0 /100 | #15 | Exceptional 8.8% |
| Lumbee | 100.0 /100 | #16 | Exceptional 8.8% |
| Ute | 100.0 /100 | #17 | Exceptional 8.8% |
| Nepalese | 100.0 /100 | #18 | Exceptional 8.7% |
| Koreans | 100.0 /100 | #19 | Exceptional 8.6% |
| Pueblo | 100.0 /100 | #20 | Exceptional 8.6% |
| Danes | 100.0 /100 | #21 | Exceptional 8.6% |
| Immigrants | Vietnam | 100.0 /100 | #22 | Exceptional 8.6% |
| Immigrants | Philippines | 100.0 /100 | #23 | Exceptional 8.5% |
| Immigrants | Central America | 100.0 /100 | #24 | Exceptional 8.5% |
| Basques | 100.0 /100 | #25 | Exceptional 8.4% |
| Mexican American Indians | 100.0 /100 | #26 | Exceptional 8.4% |
| Sri Lankans | 100.0 /100 | #27 | Exceptional 8.4% |
| Cheyenne | 100.0 /100 | #28 | Exceptional 8.3% |
| Immigrants | South Eastern Asia | 100.0 /100 | #29 | Exceptional 8.2% |