Barbadian vs Immigrants from Vietnam GED/Equivalency
COMPARE
Barbadian
Immigrants from Vietnam
GED/Equivalency
GED/Equivalency Comparison
Barbadians
Immigrants from Vietnam
82.9%
GED/EQUIVALENCY
0.1/ 100
METRIC RATING
272nd/ 347
METRIC RANK
83.2%
GED/EQUIVALENCY
0.3/ 100
METRIC RATING
259th/ 347
METRIC RANK
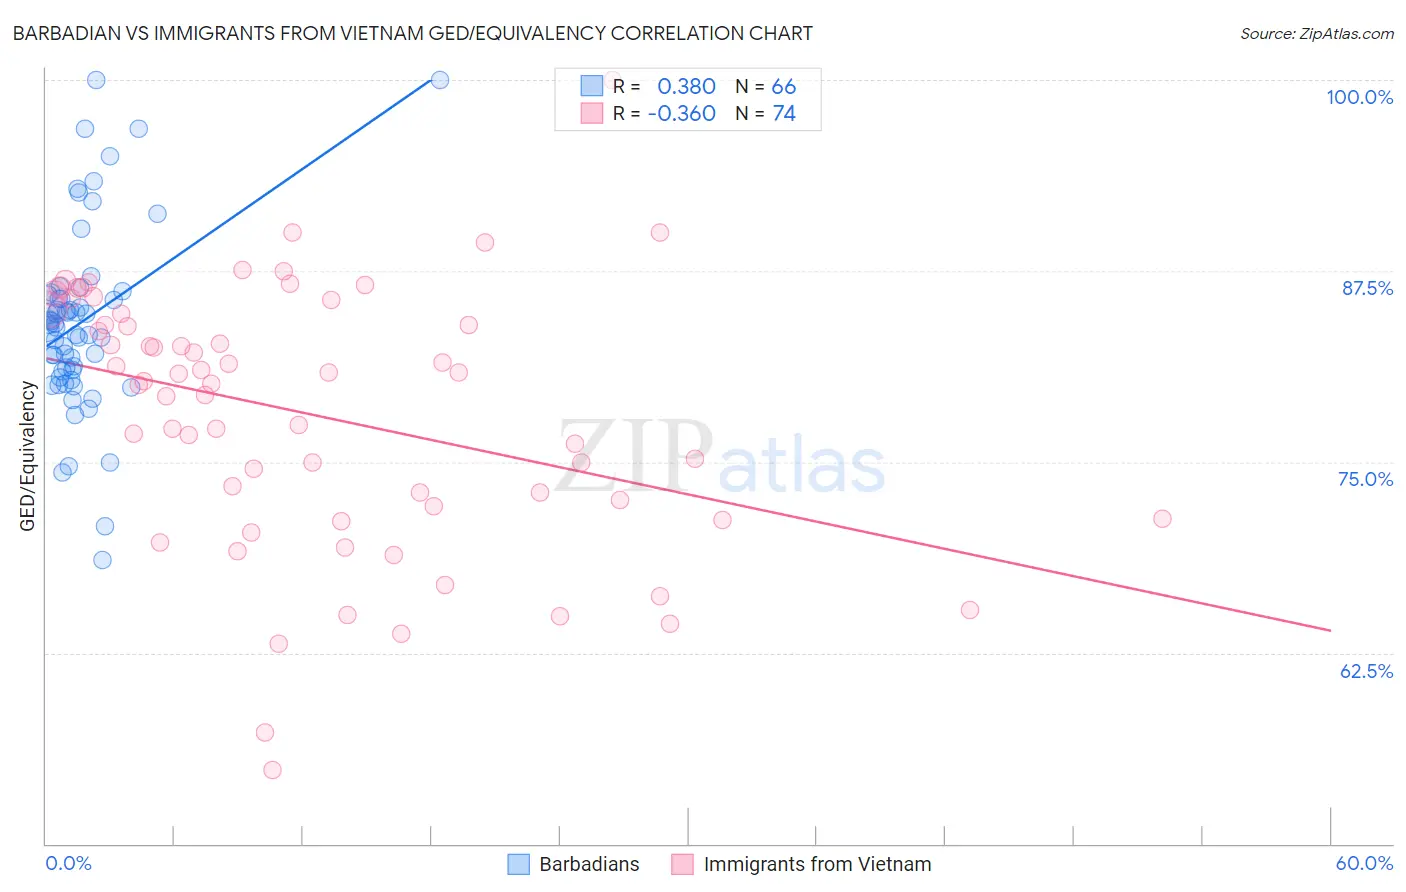
Barbadian vs Immigrants from Vietnam GED/Equivalency Correlation Chart
The statistical analysis conducted on geographies consisting of 141,302,824 people shows a mild positive correlation between the proportion of Barbadians and percentage of population with at least ged/equivalency education in the United States with a correlation coefficient (R) of 0.380 and weighted average of 82.9%. Similarly, the statistical analysis conducted on geographies consisting of 404,843,872 people shows a mild negative correlation between the proportion of Immigrants from Vietnam and percentage of population with at least ged/equivalency education in the United States with a correlation coefficient (R) of -0.360 and weighted average of 83.2%, a difference of 0.36%.
GED/Equivalency Correlation Summary
| Measurement | Barbadian | Immigrants from Vietnam |
| Minimum | 68.6% | 54.8% |
| Maximum | 100.0% | 100.0% |
| Range | 31.4% | 45.2% |
| Mean | 84.2% | 78.1% |
| Median | 83.9% | 80.2% |
| Interquartile 25% (IQ1) | 80.9% | 72.1% |
| Interquartile 75% (IQ3) | 85.9% | 84.7% |
| Interquartile Range (IQR) | 5.0% | 12.6% |
| Standard Deviation (Sample) | 6.0% | 8.5% |
| Standard Deviation (Population) | 6.0% | 8.5% |
Demographics Similar to Barbadians and Immigrants from Vietnam by GED/Equivalency
In terms of ged/equivalency, the demographic groups most similar to Barbadians are Pennsylvania German (82.9%, a difference of 0.010%), Immigrants from Trinidad and Tobago (82.8%, a difference of 0.020%), U.S. Virgin Islander (82.9%, a difference of 0.040%), Immigrants from Jamaica (82.9%, a difference of 0.080%), and Seminole (82.8%, a difference of 0.090%). Similarly, the demographic groups most similar to Immigrants from Vietnam are Choctaw (83.1%, a difference of 0.030%), Inupiat (83.1%, a difference of 0.090%), Immigrants from Armenia (83.1%, a difference of 0.090%), Immigrants from Congo (83.1%, a difference of 0.10%), and Bangladeshi (83.1%, a difference of 0.11%).
| Demographics | Rating | Rank | GED/Equivalency |
| Colville | 0.5 /100 | #255 | Tragic 83.4% |
| Africans | 0.5 /100 | #256 | Tragic 83.4% |
| Jamaicans | 0.4 /100 | #257 | Tragic 83.3% |
| Malaysians | 0.4 /100 | #258 | Tragic 83.3% |
| Immigrants | Vietnam | 0.3 /100 | #259 | Tragic 83.2% |
| Choctaw | 0.3 /100 | #260 | Tragic 83.1% |
| Inupiat | 0.2 /100 | #261 | Tragic 83.1% |
| Immigrants | Armenia | 0.2 /100 | #262 | Tragic 83.1% |
| Immigrants | Congo | 0.2 /100 | #263 | Tragic 83.1% |
| Bangladeshis | 0.2 /100 | #264 | Tragic 83.1% |
| West Indians | 0.2 /100 | #265 | Tragic 83.1% |
| Kiowa | 0.2 /100 | #266 | Tragic 83.1% |
| Trinidadians and Tobagonians | 0.2 /100 | #267 | Tragic 83.0% |
| Immigrants | Burma/Myanmar | 0.2 /100 | #268 | Tragic 83.0% |
| Hopi | 0.2 /100 | #269 | Tragic 83.0% |
| Immigrants | Jamaica | 0.2 /100 | #270 | Tragic 82.9% |
| U.S. Virgin Islanders | 0.2 /100 | #271 | Tragic 82.9% |
| Barbadians | 0.1 /100 | #272 | Tragic 82.9% |
| Pennsylvania Germans | 0.1 /100 | #273 | Tragic 82.9% |
| Immigrants | Trinidad and Tobago | 0.1 /100 | #274 | Tragic 82.8% |
| Seminole | 0.1 /100 | #275 | Tragic 82.8% |