White/Caucasian vs Immigrants from Vietnam GED/Equivalency
COMPARE
White/Caucasian
Immigrants from Vietnam
GED/Equivalency
GED/Equivalency Comparison
Whites/Caucasians
Immigrants from Vietnam
86.2%
GED/EQUIVALENCY
72.2/ 100
METRIC RATING
157th/ 347
METRIC RANK
83.2%
GED/EQUIVALENCY
0.3/ 100
METRIC RATING
259th/ 347
METRIC RANK
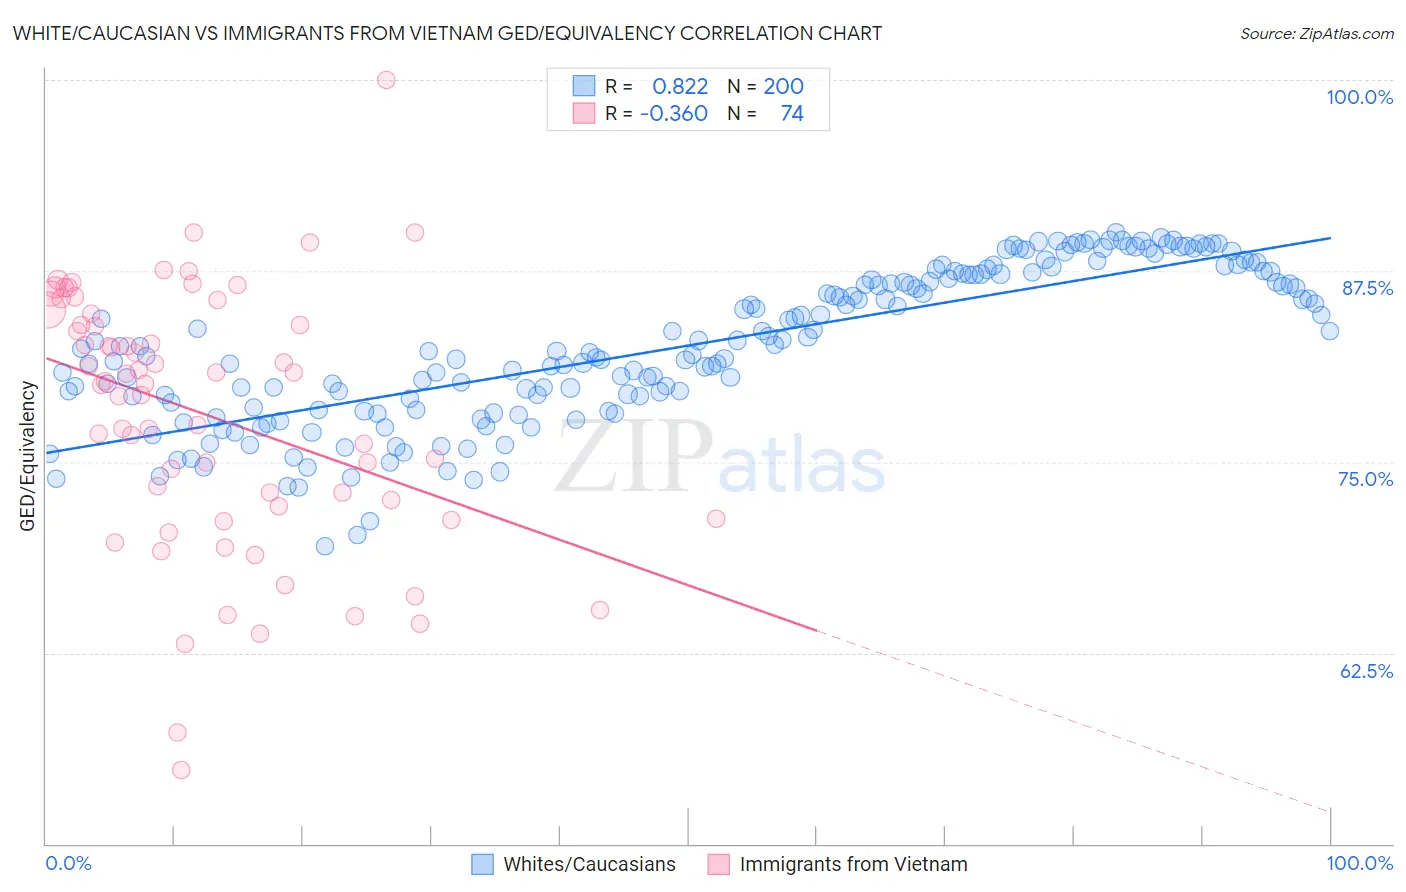
White/Caucasian vs Immigrants from Vietnam GED/Equivalency Correlation Chart
The statistical analysis conducted on geographies consisting of 585,240,437 people shows a very strong positive correlation between the proportion of Whites/Caucasians and percentage of population with at least ged/equivalency education in the United States with a correlation coefficient (R) of 0.822 and weighted average of 86.2%. Similarly, the statistical analysis conducted on geographies consisting of 404,843,872 people shows a mild negative correlation between the proportion of Immigrants from Vietnam and percentage of population with at least ged/equivalency education in the United States with a correlation coefficient (R) of -0.360 and weighted average of 83.2%, a difference of 3.6%.
GED/Equivalency Correlation Summary
| Measurement | White/Caucasian | Immigrants from Vietnam |
| Minimum | 69.4% | 54.8% |
| Maximum | 90.1% | 100.0% |
| Range | 20.6% | 45.2% |
| Mean | 82.6% | 78.1% |
| Median | 82.5% | 80.2% |
| Interquartile 25% (IQ1) | 79.0% | 72.1% |
| Interquartile 75% (IQ3) | 87.3% | 84.7% |
| Interquartile Range (IQR) | 8.3% | 12.6% |
| Standard Deviation (Sample) | 5.0% | 8.5% |
| Standard Deviation (Population) | 4.9% | 8.5% |
Similar Demographics by GED/Equivalency
Demographics Similar to Whites/Caucasians by GED/Equivalency
In terms of ged/equivalency, the demographic groups most similar to Whites/Caucasians are German Russian (86.2%, a difference of 0.0%), Immigrants from Kenya (86.2%, a difference of 0.010%), Immigrants from Nepal (86.2%, a difference of 0.030%), Immigrants from Morocco (86.1%, a difference of 0.070%), and Immigrants from Syria (86.1%, a difference of 0.070%).
| Demographics | Rating | Rank | GED/Equivalency |
| Immigrants | Western Asia | 78.8 /100 | #150 | Good 86.3% |
| Immigrants | Bosnia and Herzegovina | 77.9 /100 | #151 | Good 86.3% |
| Brazilians | 77.2 /100 | #152 | Good 86.3% |
| Kenyans | 76.6 /100 | #153 | Good 86.3% |
| Armenians | 76.4 /100 | #154 | Good 86.3% |
| Iraqis | 75.2 /100 | #155 | Good 86.2% |
| Immigrants | Nepal | 73.3 /100 | #156 | Good 86.2% |
| Whites/Caucasians | 72.2 /100 | #157 | Good 86.2% |
| German Russians | 72.1 /100 | #158 | Good 86.2% |
| Immigrants | Kenya | 71.8 /100 | #159 | Good 86.2% |
| Immigrants | Morocco | 69.5 /100 | #160 | Good 86.1% |
| Immigrants | Syria | 69.3 /100 | #161 | Good 86.1% |
| Immigrants | Iraq | 68.1 /100 | #162 | Good 86.1% |
| Ugandans | 66.3 /100 | #163 | Good 86.1% |
| Venezuelans | 65.5 /100 | #164 | Good 86.0% |
Demographics Similar to Immigrants from Vietnam by GED/Equivalency
In terms of ged/equivalency, the demographic groups most similar to Immigrants from Vietnam are Choctaw (83.1%, a difference of 0.030%), Inupiat (83.1%, a difference of 0.090%), Immigrants from Armenia (83.1%, a difference of 0.090%), Immigrants from Congo (83.1%, a difference of 0.10%), and Bangladeshi (83.1%, a difference of 0.11%).
| Demographics | Rating | Rank | GED/Equivalency |
| Bahamians | 0.8 /100 | #252 | Tragic 83.6% |
| Comanche | 0.7 /100 | #253 | Tragic 83.6% |
| Creek | 0.7 /100 | #254 | Tragic 83.6% |
| Colville | 0.5 /100 | #255 | Tragic 83.4% |
| Africans | 0.5 /100 | #256 | Tragic 83.4% |
| Jamaicans | 0.4 /100 | #257 | Tragic 83.3% |
| Malaysians | 0.4 /100 | #258 | Tragic 83.3% |
| Immigrants | Vietnam | 0.3 /100 | #259 | Tragic 83.2% |
| Choctaw | 0.3 /100 | #260 | Tragic 83.1% |
| Inupiat | 0.2 /100 | #261 | Tragic 83.1% |
| Immigrants | Armenia | 0.2 /100 | #262 | Tragic 83.1% |
| Immigrants | Congo | 0.2 /100 | #263 | Tragic 83.1% |
| Bangladeshis | 0.2 /100 | #264 | Tragic 83.1% |
| West Indians | 0.2 /100 | #265 | Tragic 83.1% |
| Kiowa | 0.2 /100 | #266 | Tragic 83.1% |