Estonian vs Filipino GED/Equivalency
COMPARE
Estonian
Filipino
GED/Equivalency
GED/Equivalency Comparison
Estonians
Filipinos
88.6%
GED/EQUIVALENCY
99.8/ 100
METRIC RATING
25th/ 347
METRIC RANK
89.5%
GED/EQUIVALENCY
100.0/ 100
METRIC RATING
2nd/ 347
METRIC RANK
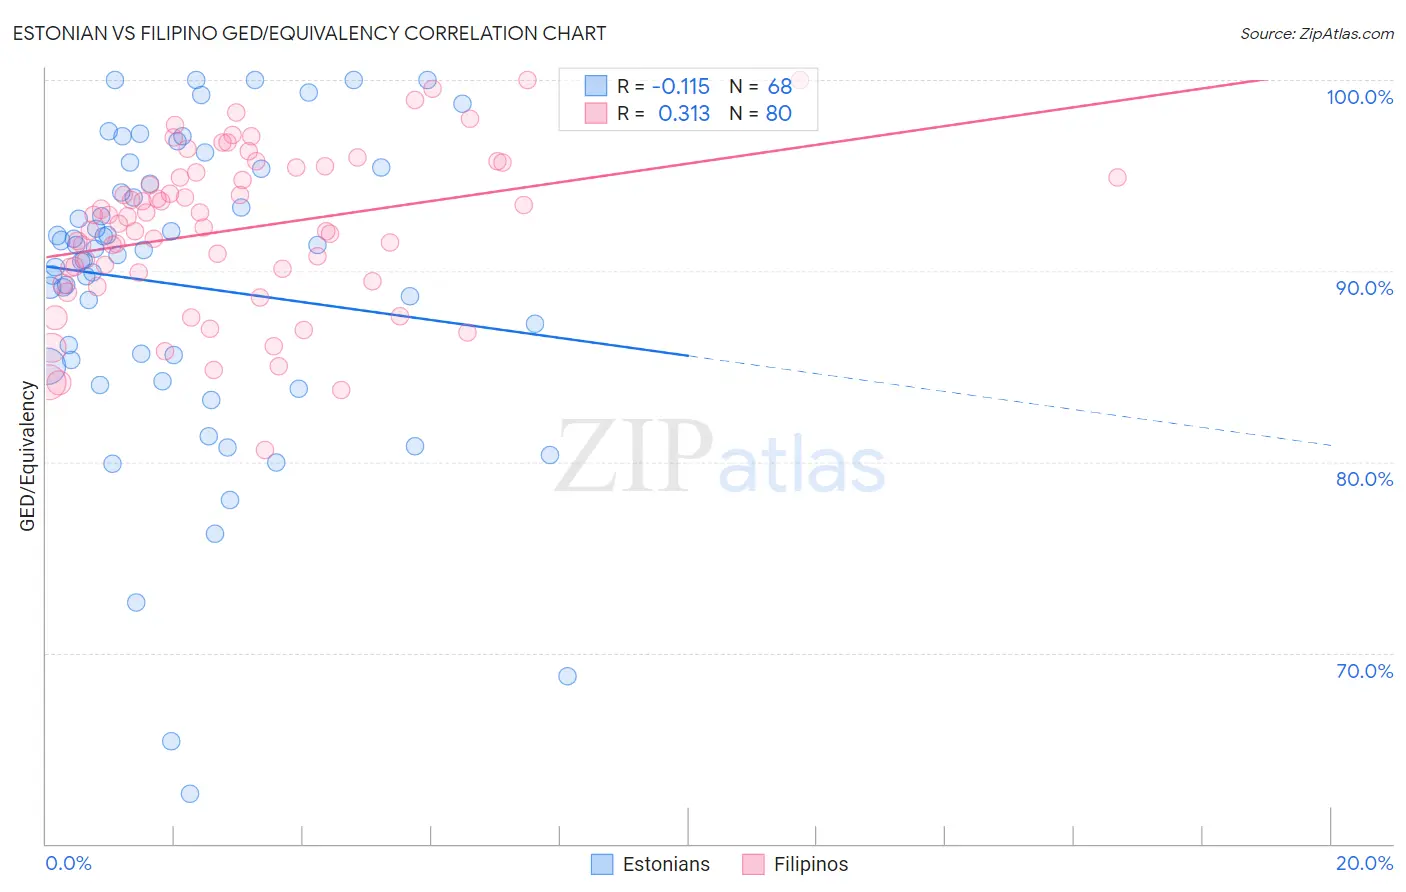
Estonian vs Filipino GED/Equivalency Correlation Chart
The statistical analysis conducted on geographies consisting of 123,527,724 people shows a poor negative correlation between the proportion of Estonians and percentage of population with at least ged/equivalency education in the United States with a correlation coefficient (R) of -0.115 and weighted average of 88.6%. Similarly, the statistical analysis conducted on geographies consisting of 254,349,672 people shows a mild positive correlation between the proportion of Filipinos and percentage of population with at least ged/equivalency education in the United States with a correlation coefficient (R) of 0.313 and weighted average of 89.5%, a difference of 1.0%.
GED/Equivalency Correlation Summary
| Measurement | Estonian | Filipino |
| Minimum | 62.6% | 80.6% |
| Maximum | 100.0% | 100.0% |
| Range | 37.4% | 19.4% |
| Mean | 89.2% | 92.2% |
| Median | 91.0% | 92.7% |
| Interquartile 25% (IQ1) | 85.2% | 89.7% |
| Interquartile 75% (IQ3) | 94.9% | 95.3% |
| Interquartile Range (IQR) | 9.8% | 5.6% |
| Standard Deviation (Sample) | 8.1% | 4.2% |
| Standard Deviation (Population) | 8.1% | 4.2% |
Similar Demographics by GED/Equivalency
Demographics Similar to Estonians by GED/Equivalency
In terms of ged/equivalency, the demographic groups most similar to Estonians are Russian (88.6%, a difference of 0.0%), Slovak (88.6%, a difference of 0.0%), Immigrants from Australia (88.6%, a difference of 0.0%), Immigrants from Ireland (88.6%, a difference of 0.020%), and Luxembourger (88.6%, a difference of 0.030%).
| Demographics | Rating | Rank | GED/Equivalency |
| Slovenes | 99.9 /100 | #18 | Exceptional 88.8% |
| Swedes | 99.9 /100 | #19 | Exceptional 88.8% |
| Maltese | 99.9 /100 | #20 | Exceptional 88.6% |
| Luxembourgers | 99.8 /100 | #21 | Exceptional 88.6% |
| Immigrants | Ireland | 99.8 /100 | #22 | Exceptional 88.6% |
| Russians | 99.8 /100 | #23 | Exceptional 88.6% |
| Slovaks | 99.8 /100 | #24 | Exceptional 88.6% |
| Estonians | 99.8 /100 | #25 | Exceptional 88.6% |
| Immigrants | Australia | 99.8 /100 | #26 | Exceptional 88.6% |
| Immigrants | Lithuania | 99.8 /100 | #27 | Exceptional 88.6% |
| Immigrants | Northern Europe | 99.8 /100 | #28 | Exceptional 88.5% |
| Poles | 99.8 /100 | #29 | Exceptional 88.5% |
| Turks | 99.8 /100 | #30 | Exceptional 88.5% |
| Bhutanese | 99.8 /100 | #31 | Exceptional 88.4% |
| Danes | 99.8 /100 | #32 | Exceptional 88.4% |
Demographics Similar to Filipinos by GED/Equivalency
In terms of ged/equivalency, the demographic groups most similar to Filipinos are Immigrants from Singapore (89.3%, a difference of 0.21%), Immigrants from India (89.7%, a difference of 0.26%), Iranian (89.2%, a difference of 0.30%), Latvian (89.2%, a difference of 0.40%), and Thai (89.1%, a difference of 0.42%).
| Demographics | Rating | Rank | GED/Equivalency |
| Immigrants | India | 100.0 /100 | #1 | Exceptional 89.7% |
| Filipinos | 100.0 /100 | #2 | Exceptional 89.5% |
| Immigrants | Singapore | 100.0 /100 | #3 | Exceptional 89.3% |
| Iranians | 100.0 /100 | #4 | Exceptional 89.2% |
| Latvians | 100.0 /100 | #5 | Exceptional 89.2% |
| Thais | 100.0 /100 | #6 | Exceptional 89.1% |
| Eastern Europeans | 99.9 /100 | #7 | Exceptional 89.1% |
| Carpatho Rusyns | 99.9 /100 | #8 | Exceptional 89.1% |
| Chinese | 99.9 /100 | #9 | Exceptional 89.0% |
| Norwegians | 99.9 /100 | #10 | Exceptional 89.0% |
| Bulgarians | 99.9 /100 | #11 | Exceptional 89.0% |
| Lithuanians | 99.9 /100 | #12 | Exceptional 88.9% |
| Immigrants | Iran | 99.9 /100 | #13 | Exceptional 88.9% |
| Cypriots | 99.9 /100 | #14 | Exceptional 88.9% |
| Okinawans | 99.9 /100 | #15 | Exceptional 88.9% |