Estonian vs Immigrants from Nepal Family Households
COMPARE
Estonian
Immigrants from Nepal
Family Households
Family Households Comparison
Estonians
Immigrants from Nepal
62.9%
FAMILY HOUSEHOLDS
0.2/ 100
METRIC RATING
281st/ 347
METRIC RANK
62.7%
FAMILY HOUSEHOLDS
0.1/ 100
METRIC RATING
289th/ 347
METRIC RANK
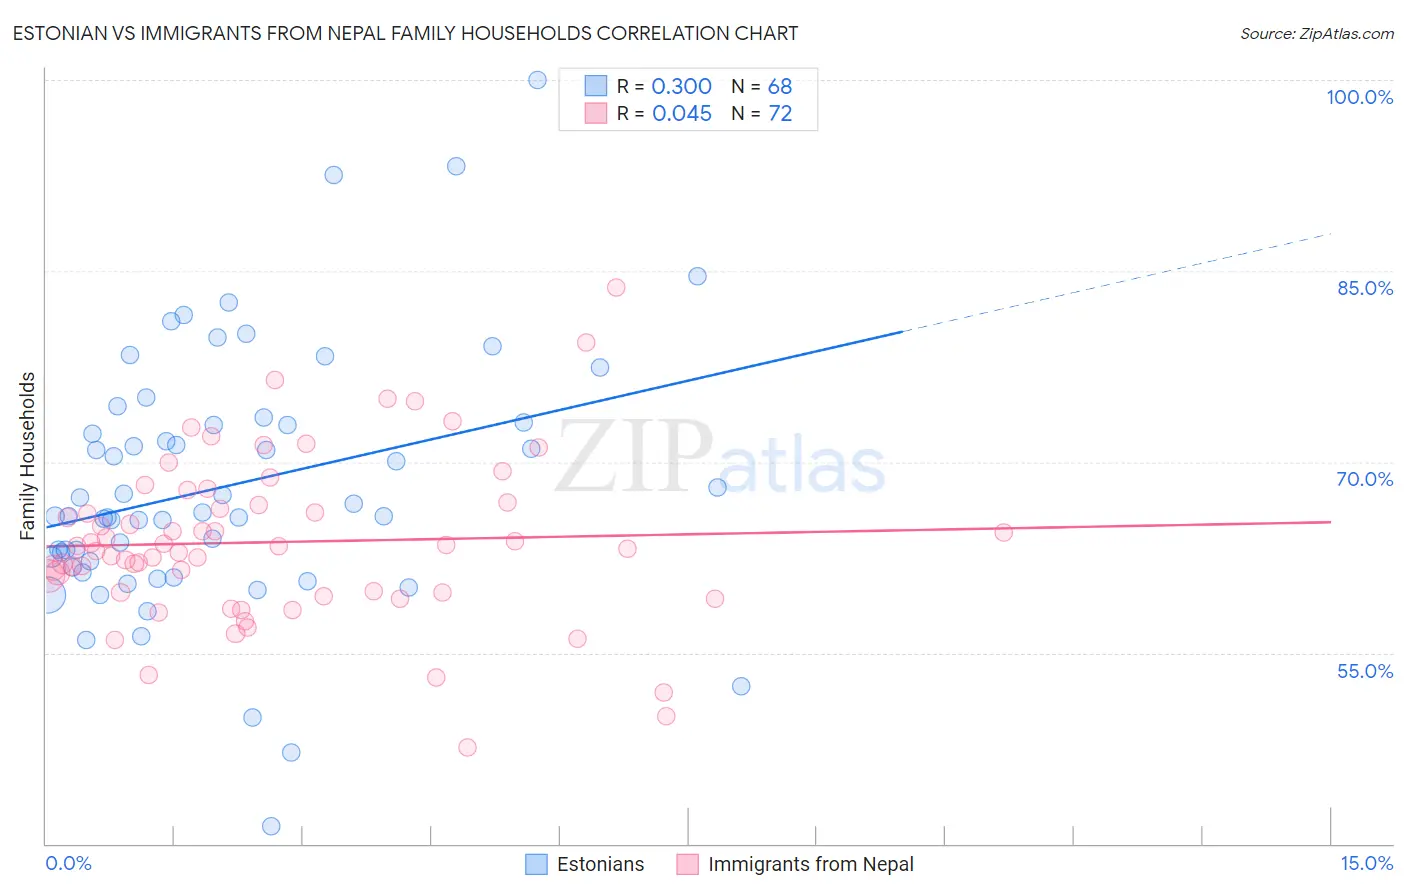
Estonian vs Immigrants from Nepal Family Households Correlation Chart
The statistical analysis conducted on geographies consisting of 123,500,742 people shows a weak positive correlation between the proportion of Estonians and percentage of family households in the United States with a correlation coefficient (R) of 0.300 and weighted average of 62.9%. Similarly, the statistical analysis conducted on geographies consisting of 186,706,837 people shows no correlation between the proportion of Immigrants from Nepal and percentage of family households in the United States with a correlation coefficient (R) of 0.045 and weighted average of 62.7%, a difference of 0.33%.
Family Households Correlation Summary
| Measurement | Estonian | Immigrants from Nepal |
| Minimum | 41.3% | 47.6% |
| Maximum | 100.0% | 83.7% |
| Range | 58.7% | 36.1% |
| Mean | 68.1% | 63.7% |
| Median | 65.9% | 63.3% |
| Interquartile 25% (IQ1) | 61.9% | 59.7% |
| Interquartile 75% (IQ3) | 73.0% | 66.7% |
| Interquartile Range (IQR) | 11.1% | 7.0% |
| Standard Deviation (Sample) | 10.2% | 6.5% |
| Standard Deviation (Population) | 10.2% | 6.4% |
Demographics Similar to Estonians and Immigrants from Nepal by Family Households
In terms of family households, the demographic groups most similar to Estonians are New Zealander (62.9%, a difference of 0.030%), Immigrants from Denmark (62.9%, a difference of 0.040%), Australian (62.8%, a difference of 0.080%), Immigrants from Bulgaria (63.0%, a difference of 0.090%), and Immigrants from Yemen (63.0%, a difference of 0.11%). Similarly, the demographic groups most similar to Immigrants from Nepal are Immigrants from Grenada (62.6%, a difference of 0.080%), Immigrants from Uganda (62.7%, a difference of 0.090%), British West Indian (62.8%, a difference of 0.11%), Latvian (62.8%, a difference of 0.11%), and U.S. Virgin Islander (62.6%, a difference of 0.13%).
| Demographics | Rating | Rank | Family Households |
| West Indians | 0.3 /100 | #275 | Tragic 63.1% |
| Serbians | 0.3 /100 | #276 | Tragic 63.0% |
| Ottawa | 0.3 /100 | #277 | Tragic 63.0% |
| Immigrants | Belgium | 0.2 /100 | #278 | Tragic 63.0% |
| Immigrants | Yemen | 0.2 /100 | #279 | Tragic 63.0% |
| Immigrants | Bulgaria | 0.2 /100 | #280 | Tragic 63.0% |
| Estonians | 0.2 /100 | #281 | Tragic 62.9% |
| New Zealanders | 0.1 /100 | #282 | Tragic 62.9% |
| Immigrants | Denmark | 0.1 /100 | #283 | Tragic 62.9% |
| Australians | 0.1 /100 | #284 | Tragic 62.8% |
| Mongolians | 0.1 /100 | #285 | Tragic 62.8% |
| British West Indians | 0.1 /100 | #286 | Tragic 62.8% |
| Latvians | 0.1 /100 | #287 | Tragic 62.8% |
| Immigrants | Uganda | 0.1 /100 | #288 | Tragic 62.7% |
| Immigrants | Nepal | 0.1 /100 | #289 | Tragic 62.7% |
| Immigrants | Grenada | 0.0 /100 | #290 | Tragic 62.6% |
| U.S. Virgin Islanders | 0.0 /100 | #291 | Tragic 62.6% |
| Immigrants | Burma/Myanmar | 0.0 /100 | #292 | Tragic 62.6% |
| Immigrants | Sweden | 0.0 /100 | #293 | Tragic 62.5% |
| Barbadians | 0.0 /100 | #294 | Tragic 62.5% |
| Okinawans | 0.0 /100 | #295 | Tragic 62.5% |