Estonian vs Immigrants from Nepal Associate's Degree
COMPARE
Estonian
Immigrants from Nepal
Associate's Degree
Associate's Degree Comparison
Estonians
Immigrants from Nepal
52.5%
ASSOCIATE'S DEGREE
99.9/ 100
METRIC RATING
44th/ 347
METRIC RANK
49.5%
ASSOCIATE'S DEGREE
97.5/ 100
METRIC RATING
100th/ 347
METRIC RANK
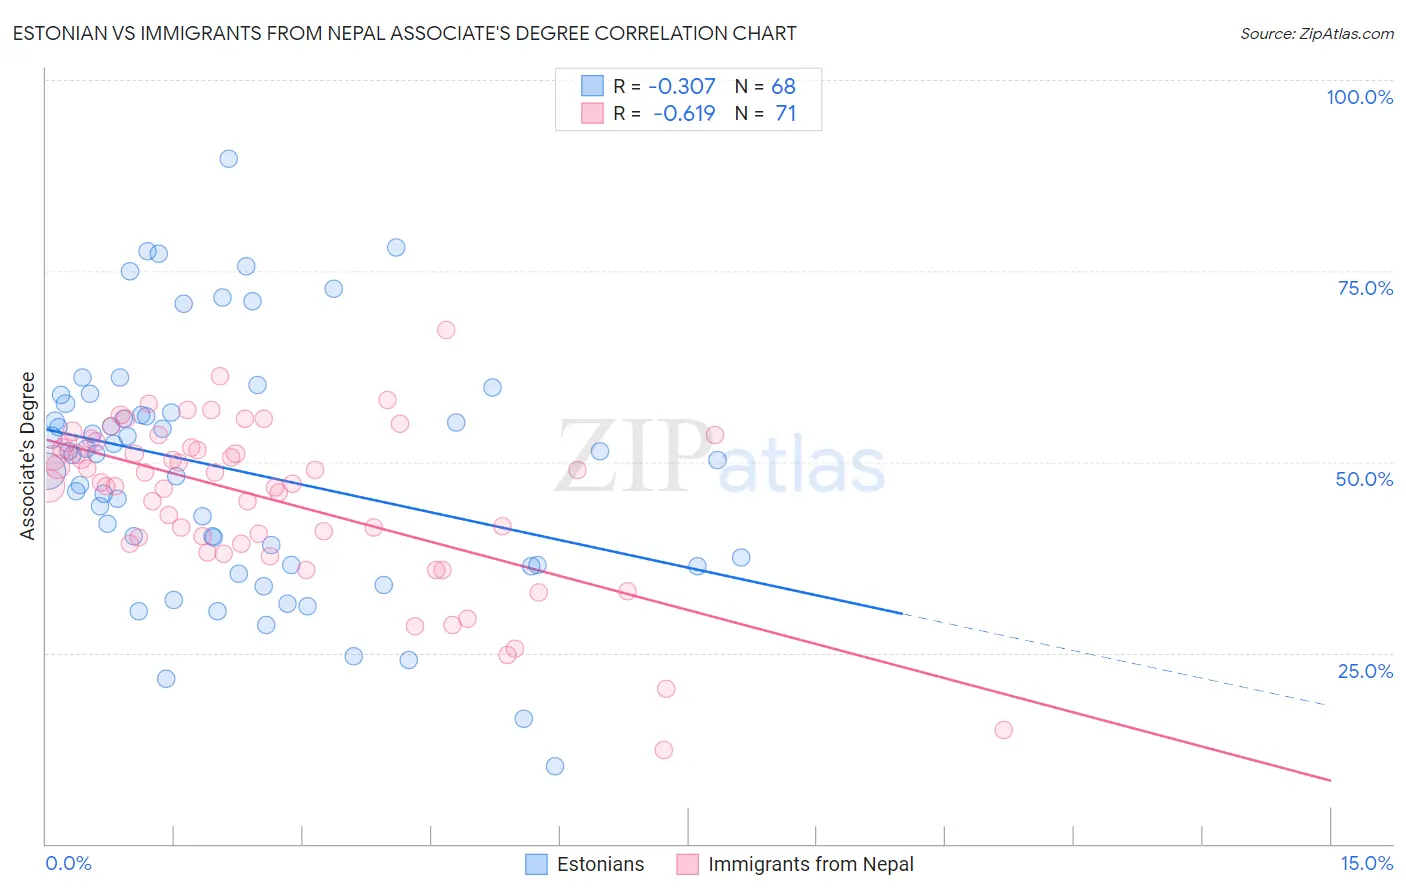
Estonian vs Immigrants from Nepal Associate's Degree Correlation Chart
The statistical analysis conducted on geographies consisting of 123,528,324 people shows a mild negative correlation between the proportion of Estonians and percentage of population with at least associate's degree education in the United States with a correlation coefficient (R) of -0.307 and weighted average of 52.5%. Similarly, the statistical analysis conducted on geographies consisting of 186,769,874 people shows a significant negative correlation between the proportion of Immigrants from Nepal and percentage of population with at least associate's degree education in the United States with a correlation coefficient (R) of -0.619 and weighted average of 49.5%, a difference of 5.9%.
Associate's Degree Correlation Summary
| Measurement | Estonian | Immigrants from Nepal |
| Minimum | 10.2% | 12.3% |
| Maximum | 89.7% | 67.3% |
| Range | 79.5% | 55.0% |
| Mean | 49.0% | 45.2% |
| Median | 51.0% | 47.3% |
| Interquartile 25% (IQ1) | 36.5% | 39.2% |
| Interquartile 75% (IQ3) | 57.1% | 52.6% |
| Interquartile Range (IQR) | 20.5% | 13.3% |
| Standard Deviation (Sample) | 16.0% | 10.7% |
| Standard Deviation (Population) | 15.9% | 10.6% |
Similar Demographics by Associate's Degree
Demographics Similar to Estonians by Associate's Degree
In terms of associate's degree, the demographic groups most similar to Estonians are Immigrants from Lithuania (52.4%, a difference of 0.080%), Immigrants from South Africa (52.5%, a difference of 0.090%), Immigrants from Malaysia (52.5%, a difference of 0.10%), Immigrants from Saudi Arabia (52.6%, a difference of 0.13%), and Immigrants from Bulgaria (52.4%, a difference of 0.21%).
| Demographics | Rating | Rank | Associate's Degree |
| Immigrants | Denmark | 100.0 /100 | #37 | Exceptional 53.1% |
| Mongolians | 100.0 /100 | #38 | Exceptional 53.0% |
| Immigrants | Belarus | 99.9 /100 | #39 | Exceptional 52.8% |
| Immigrants | Latvia | 99.9 /100 | #40 | Exceptional 52.8% |
| Immigrants | Saudi Arabia | 99.9 /100 | #41 | Exceptional 52.6% |
| Immigrants | Malaysia | 99.9 /100 | #42 | Exceptional 52.5% |
| Immigrants | South Africa | 99.9 /100 | #43 | Exceptional 52.5% |
| Estonians | 99.9 /100 | #44 | Exceptional 52.5% |
| Immigrants | Lithuania | 99.9 /100 | #45 | Exceptional 52.4% |
| Immigrants | Bulgaria | 99.9 /100 | #46 | Exceptional 52.4% |
| Immigrants | Kuwait | 99.9 /100 | #47 | Exceptional 52.4% |
| Immigrants | Norway | 99.9 /100 | #48 | Exceptional 52.2% |
| Immigrants | Austria | 99.9 /100 | #49 | Exceptional 52.1% |
| Asians | 99.9 /100 | #50 | Exceptional 52.1% |
| Immigrants | Greece | 99.9 /100 | #51 | Exceptional 52.1% |
Demographics Similar to Immigrants from Nepal by Associate's Degree
In terms of associate's degree, the demographic groups most similar to Immigrants from Nepal are Northern European (49.5%, a difference of 0.16%), Chilean (49.4%, a difference of 0.19%), Macedonian (49.6%, a difference of 0.22%), Immigrants from Northern Africa (49.7%, a difference of 0.28%), and Ukrainian (49.4%, a difference of 0.29%).
| Demographics | Rating | Rank | Associate's Degree |
| Immigrants | Brazil | 98.5 /100 | #93 | Exceptional 50.0% |
| Laotians | 98.4 /100 | #94 | Exceptional 49.9% |
| Immigrants | England | 98.0 /100 | #95 | Exceptional 49.7% |
| Romanians | 98.0 /100 | #96 | Exceptional 49.7% |
| Immigrants | Ukraine | 98.0 /100 | #97 | Exceptional 49.7% |
| Immigrants | Northern Africa | 97.9 /100 | #98 | Exceptional 49.7% |
| Macedonians | 97.8 /100 | #99 | Exceptional 49.6% |
| Immigrants | Nepal | 97.5 /100 | #100 | Exceptional 49.5% |
| Northern Europeans | 97.3 /100 | #101 | Exceptional 49.5% |
| Chileans | 97.3 /100 | #102 | Exceptional 49.4% |
| Ukrainians | 97.1 /100 | #103 | Exceptional 49.4% |
| Venezuelans | 97.0 /100 | #104 | Exceptional 49.4% |
| Croatians | 96.8 /100 | #105 | Exceptional 49.3% |
| Immigrants | Italy | 96.7 /100 | #106 | Exceptional 49.3% |
| Syrians | 96.7 /100 | #107 | Exceptional 49.3% |