Estonian vs Osage GED/Equivalency
COMPARE
Estonian
Osage
GED/Equivalency
GED/Equivalency Comparison
Estonians
Osage
88.6%
GED/EQUIVALENCY
99.8/ 100
METRIC RATING
25th/ 347
METRIC RANK
84.8%
GED/EQUIVALENCY
9.5/ 100
METRIC RATING
214th/ 347
METRIC RANK
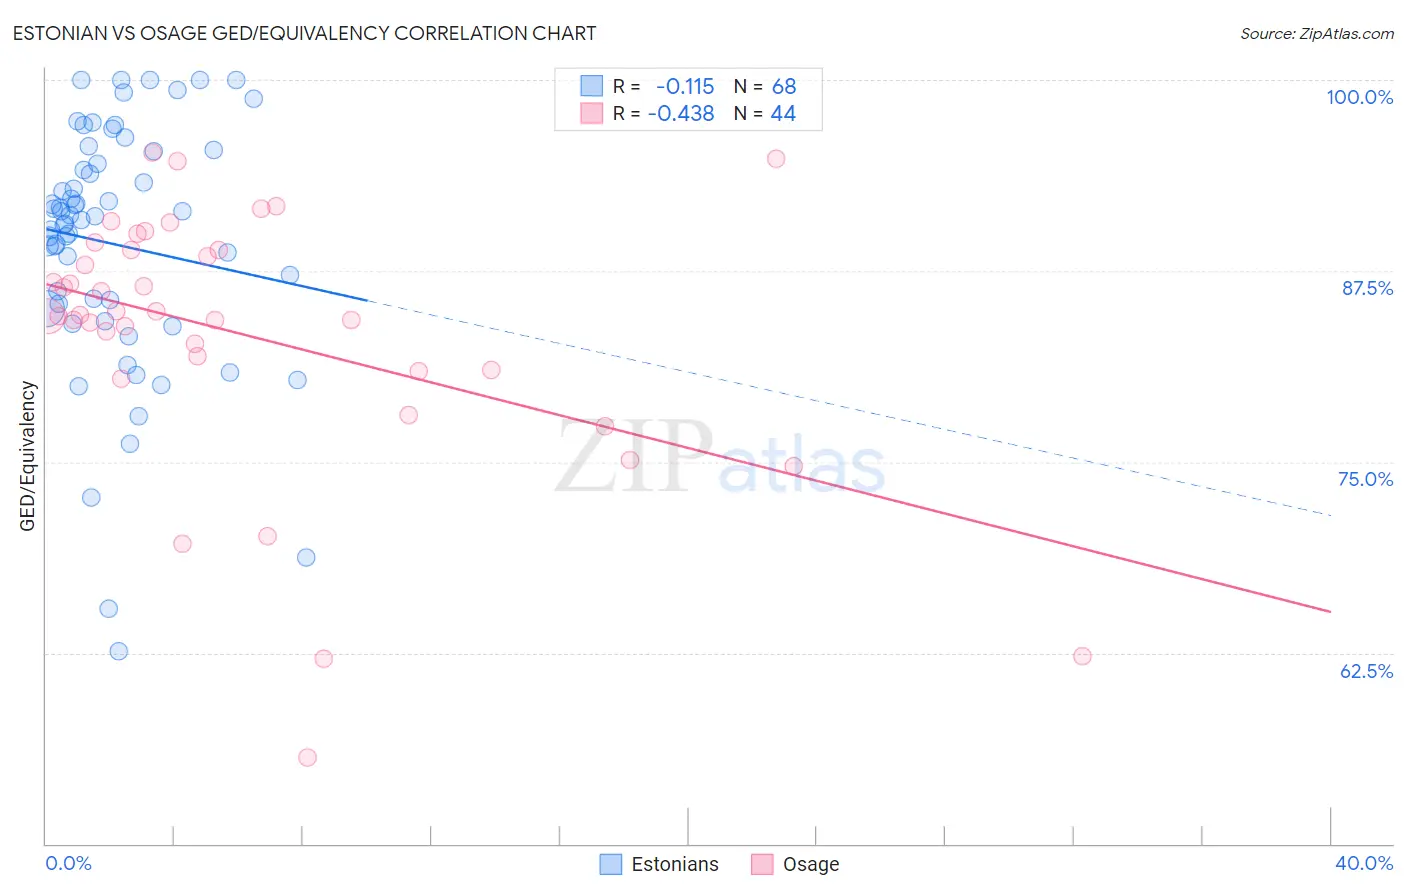
Estonian vs Osage GED/Equivalency Correlation Chart
The statistical analysis conducted on geographies consisting of 123,527,724 people shows a poor negative correlation between the proportion of Estonians and percentage of population with at least ged/equivalency education in the United States with a correlation coefficient (R) of -0.115 and weighted average of 88.6%. Similarly, the statistical analysis conducted on geographies consisting of 91,808,913 people shows a moderate negative correlation between the proportion of Osage and percentage of population with at least ged/equivalency education in the United States with a correlation coefficient (R) of -0.438 and weighted average of 84.8%, a difference of 4.5%.
GED/Equivalency Correlation Summary
| Measurement | Estonian | Osage |
| Minimum | 62.6% | 55.6% |
| Maximum | 100.0% | 95.3% |
| Range | 37.4% | 39.6% |
| Mean | 89.2% | 83.3% |
| Median | 91.0% | 84.6% |
| Interquartile 25% (IQ1) | 85.2% | 81.0% |
| Interquartile 75% (IQ3) | 94.9% | 88.9% |
| Interquartile Range (IQR) | 9.8% | 7.9% |
| Standard Deviation (Sample) | 8.1% | 8.6% |
| Standard Deviation (Population) | 8.1% | 8.5% |
Similar Demographics by GED/Equivalency
Demographics Similar to Estonians by GED/Equivalency
In terms of ged/equivalency, the demographic groups most similar to Estonians are Russian (88.6%, a difference of 0.0%), Slovak (88.6%, a difference of 0.0%), Immigrants from Australia (88.6%, a difference of 0.0%), Immigrants from Ireland (88.6%, a difference of 0.020%), and Luxembourger (88.6%, a difference of 0.030%).
| Demographics | Rating | Rank | GED/Equivalency |
| Slovenes | 99.9 /100 | #18 | Exceptional 88.8% |
| Swedes | 99.9 /100 | #19 | Exceptional 88.8% |
| Maltese | 99.9 /100 | #20 | Exceptional 88.6% |
| Luxembourgers | 99.8 /100 | #21 | Exceptional 88.6% |
| Immigrants | Ireland | 99.8 /100 | #22 | Exceptional 88.6% |
| Russians | 99.8 /100 | #23 | Exceptional 88.6% |
| Slovaks | 99.8 /100 | #24 | Exceptional 88.6% |
| Estonians | 99.8 /100 | #25 | Exceptional 88.6% |
| Immigrants | Australia | 99.8 /100 | #26 | Exceptional 88.6% |
| Immigrants | Lithuania | 99.8 /100 | #27 | Exceptional 88.6% |
| Immigrants | Northern Europe | 99.8 /100 | #28 | Exceptional 88.5% |
| Poles | 99.8 /100 | #29 | Exceptional 88.5% |
| Turks | 99.8 /100 | #30 | Exceptional 88.5% |
| Bhutanese | 99.8 /100 | #31 | Exceptional 88.4% |
| Danes | 99.8 /100 | #32 | Exceptional 88.4% |
Demographics Similar to Osage by GED/Equivalency
In terms of ged/equivalency, the demographic groups most similar to Osage are Peruvian (84.7%, a difference of 0.020%), Immigrants from Philippines (84.8%, a difference of 0.030%), Immigrants from Micronesia (84.7%, a difference of 0.050%), Nigerian (84.7%, a difference of 0.050%), and Immigrants from Somalia (84.8%, a difference of 0.060%).
| Demographics | Rating | Rank | GED/Equivalency |
| Hmong | 13.1 /100 | #207 | Poor 84.9% |
| Marshallese | 12.5 /100 | #208 | Poor 84.9% |
| Colombians | 12.3 /100 | #209 | Poor 84.9% |
| Immigrants | Cameroon | 12.1 /100 | #210 | Poor 84.9% |
| South Americans | 10.9 /100 | #211 | Poor 84.8% |
| Immigrants | Somalia | 10.6 /100 | #212 | Poor 84.8% |
| Immigrants | Philippines | 10.0 /100 | #213 | Poor 84.8% |
| Osage | 9.5 /100 | #214 | Tragic 84.8% |
| Peruvians | 9.2 /100 | #215 | Tragic 84.7% |
| Immigrants | Micronesia | 8.7 /100 | #216 | Tragic 84.7% |
| Nigerians | 8.6 /100 | #217 | Tragic 84.7% |
| Alaska Natives | 8.6 /100 | #218 | Tragic 84.7% |
| Potawatomi | 8.2 /100 | #219 | Tragic 84.7% |
| Americans | 8.2 /100 | #220 | Tragic 84.7% |
| Taiwanese | 8.1 /100 | #221 | Tragic 84.7% |