Dominican vs Kenyan High School Diploma
COMPARE
Dominican
Kenyan
High School Diploma
High School Diploma Comparison
Dominicans
Kenyans
82.9%
HIGH SCHOOL DIPLOMA
0.0/ 100
METRIC RATING
328th/ 347
METRIC RANK
89.6%
HIGH SCHOOL DIPLOMA
81.4/ 100
METRIC RATING
139th/ 347
METRIC RANK
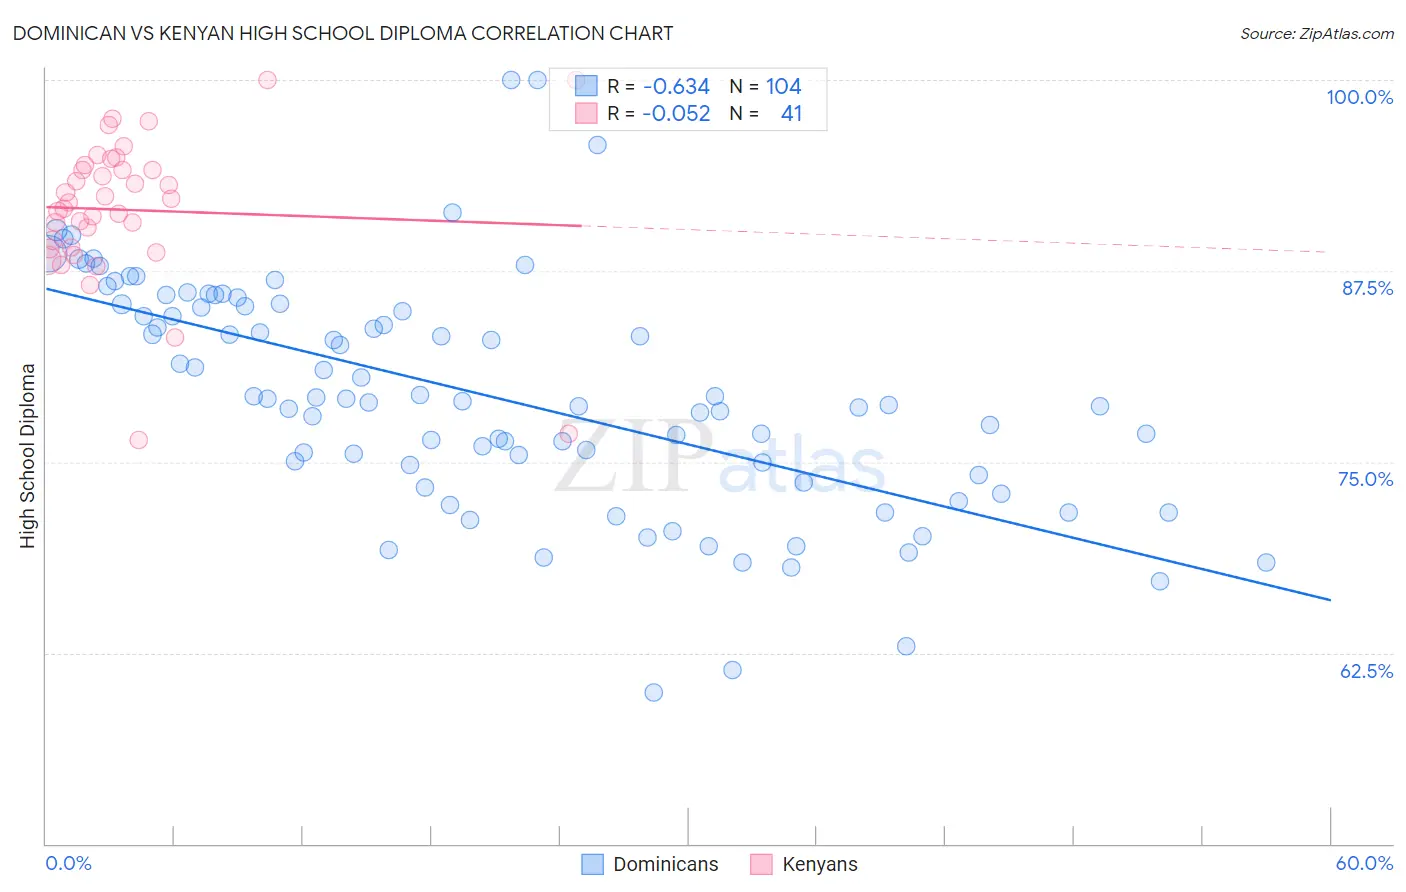
Dominican vs Kenyan High School Diploma Correlation Chart
The statistical analysis conducted on geographies consisting of 355,143,036 people shows a significant negative correlation between the proportion of Dominicans and percentage of population with at least high school diploma education in the United States with a correlation coefficient (R) of -0.634 and weighted average of 82.9%. Similarly, the statistical analysis conducted on geographies consisting of 168,243,895 people shows a slight negative correlation between the proportion of Kenyans and percentage of population with at least high school diploma education in the United States with a correlation coefficient (R) of -0.052 and weighted average of 89.6%, a difference of 8.1%.
High School Diploma Correlation Summary
| Measurement | Dominican | Kenyan |
| Minimum | 59.9% | 76.4% |
| Maximum | 100.0% | 100.0% |
| Range | 40.1% | 23.6% |
| Mean | 79.4% | 91.5% |
| Median | 79.0% | 92.0% |
| Interquartile 25% (IQ1) | 74.5% | 89.0% |
| Interquartile 75% (IQ3) | 85.3% | 94.3% |
| Interquartile Range (IQR) | 10.8% | 5.2% |
| Standard Deviation (Sample) | 7.6% | 4.9% |
| Standard Deviation (Population) | 7.6% | 4.8% |
Similar Demographics by High School Diploma
Demographics Similar to Dominicans by High School Diploma
In terms of high school diploma, the demographic groups most similar to Dominicans are Honduran (83.0%, a difference of 0.050%), Mexican American Indian (83.0%, a difference of 0.090%), Hispanic or Latino (82.9%, a difference of 0.10%), Immigrants from Nicaragua (83.1%, a difference of 0.16%), and Immigrants from the Azores (82.8%, a difference of 0.17%).
| Demographics | Rating | Rank | High School Diploma |
| Yuman | 0.0 /100 | #321 | Tragic 84.0% |
| Lumbee | 0.0 /100 | #322 | Tragic 83.6% |
| Immigrants | Cuba | 0.0 /100 | #323 | Tragic 83.5% |
| Immigrants | Cabo Verde | 0.0 /100 | #324 | Tragic 83.3% |
| Immigrants | Nicaragua | 0.0 /100 | #325 | Tragic 83.1% |
| Mexican American Indians | 0.0 /100 | #326 | Tragic 83.0% |
| Hondurans | 0.0 /100 | #327 | Tragic 83.0% |
| Dominicans | 0.0 /100 | #328 | Tragic 82.9% |
| Hispanics or Latinos | 0.0 /100 | #329 | Tragic 82.9% |
| Immigrants | Azores | 0.0 /100 | #330 | Tragic 82.8% |
| Central Americans | 0.0 /100 | #331 | Tragic 82.5% |
| Immigrants | Honduras | 0.0 /100 | #332 | Tragic 82.5% |
| Immigrants | Latin America | 0.0 /100 | #333 | Tragic 82.1% |
| Tohono O'odham | 0.0 /100 | #334 | Tragic 82.1% |
| Guatemalans | 0.0 /100 | #335 | Tragic 82.0% |
Demographics Similar to Kenyans by High School Diploma
In terms of high school diploma, the demographic groups most similar to Kenyans are Immigrants from Egypt (89.6%, a difference of 0.010%), Assyrian/Chaldean/Syriac (89.7%, a difference of 0.030%), Ugandan (89.7%, a difference of 0.060%), Arab (89.7%, a difference of 0.060%), and Chilean (89.6%, a difference of 0.060%).
| Demographics | Rating | Rank | High School Diploma |
| Immigrants | Bosnia and Herzegovina | 87.3 /100 | #132 | Excellent 89.8% |
| Albanians | 87.2 /100 | #133 | Excellent 89.8% |
| Immigrants | Jordan | 87.2 /100 | #134 | Excellent 89.8% |
| Chippewa | 85.6 /100 | #135 | Excellent 89.7% |
| Ugandans | 83.7 /100 | #136 | Excellent 89.7% |
| Arabs | 83.6 /100 | #137 | Excellent 89.7% |
| Assyrians/Chaldeans/Syriacs | 82.5 /100 | #138 | Excellent 89.7% |
| Kenyans | 81.4 /100 | #139 | Excellent 89.6% |
| Immigrants | Egypt | 81.2 /100 | #140 | Excellent 89.6% |
| Chileans | 79.0 /100 | #141 | Good 89.6% |
| Indians (Asian) | 78.8 /100 | #142 | Good 89.6% |
| Pakistanis | 78.3 /100 | #143 | Good 89.6% |
| Immigrants | Kenya | 78.0 /100 | #144 | Good 89.6% |
| Immigrants | Brazil | 76.6 /100 | #145 | Good 89.5% |
| Immigrants | Spain | 76.2 /100 | #146 | Good 89.5% |