Dominican vs Immigrants from Cameroon High School Diploma
COMPARE
Dominican
Immigrants from Cameroon
High School Diploma
High School Diploma Comparison
Dominicans
Immigrants from Cameroon
82.9%
HIGH SCHOOL DIPLOMA
0.0/ 100
METRIC RATING
328th/ 347
METRIC RANK
88.4%
HIGH SCHOOL DIPLOMA
10.9/ 100
METRIC RATING
214th/ 347
METRIC RANK
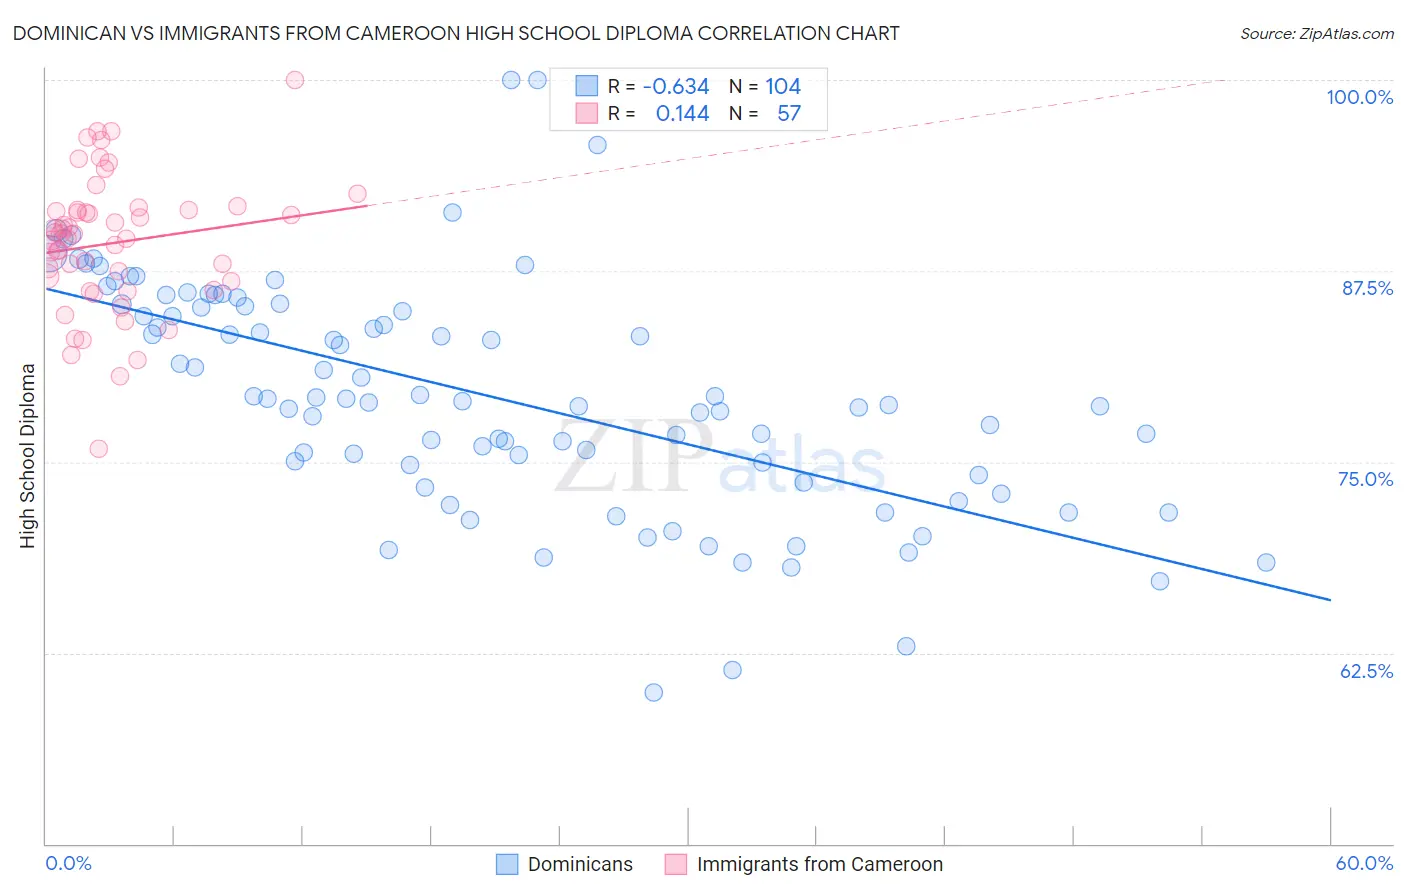
Dominican vs Immigrants from Cameroon High School Diploma Correlation Chart
The statistical analysis conducted on geographies consisting of 355,143,036 people shows a significant negative correlation between the proportion of Dominicans and percentage of population with at least high school diploma education in the United States with a correlation coefficient (R) of -0.634 and weighted average of 82.9%. Similarly, the statistical analysis conducted on geographies consisting of 130,618,704 people shows a poor positive correlation between the proportion of Immigrants from Cameroon and percentage of population with at least high school diploma education in the United States with a correlation coefficient (R) of 0.144 and weighted average of 88.4%, a difference of 6.6%.
High School Diploma Correlation Summary
| Measurement | Dominican | Immigrants from Cameroon |
| Minimum | 59.9% | 75.9% |
| Maximum | 100.0% | 100.0% |
| Range | 40.1% | 24.1% |
| Mean | 79.4% | 89.3% |
| Median | 79.0% | 89.9% |
| Interquartile 25% (IQ1) | 74.5% | 86.5% |
| Interquartile 75% (IQ3) | 85.3% | 91.5% |
| Interquartile Range (IQR) | 10.8% | 4.9% |
| Standard Deviation (Sample) | 7.6% | 4.5% |
| Standard Deviation (Population) | 7.6% | 4.4% |
Similar Demographics by High School Diploma
Demographics Similar to Dominicans by High School Diploma
In terms of high school diploma, the demographic groups most similar to Dominicans are Honduran (83.0%, a difference of 0.050%), Mexican American Indian (83.0%, a difference of 0.090%), Hispanic or Latino (82.9%, a difference of 0.10%), Immigrants from Nicaragua (83.1%, a difference of 0.16%), and Immigrants from the Azores (82.8%, a difference of 0.17%).
| Demographics | Rating | Rank | High School Diploma |
| Yuman | 0.0 /100 | #321 | Tragic 84.0% |
| Lumbee | 0.0 /100 | #322 | Tragic 83.6% |
| Immigrants | Cuba | 0.0 /100 | #323 | Tragic 83.5% |
| Immigrants | Cabo Verde | 0.0 /100 | #324 | Tragic 83.3% |
| Immigrants | Nicaragua | 0.0 /100 | #325 | Tragic 83.1% |
| Mexican American Indians | 0.0 /100 | #326 | Tragic 83.0% |
| Hondurans | 0.0 /100 | #327 | Tragic 83.0% |
| Dominicans | 0.0 /100 | #328 | Tragic 82.9% |
| Hispanics or Latinos | 0.0 /100 | #329 | Tragic 82.9% |
| Immigrants | Azores | 0.0 /100 | #330 | Tragic 82.8% |
| Central Americans | 0.0 /100 | #331 | Tragic 82.5% |
| Immigrants | Honduras | 0.0 /100 | #332 | Tragic 82.5% |
| Immigrants | Latin America | 0.0 /100 | #333 | Tragic 82.1% |
| Tohono O'odham | 0.0 /100 | #334 | Tragic 82.1% |
| Guatemalans | 0.0 /100 | #335 | Tragic 82.0% |
Demographics Similar to Immigrants from Cameroon by High School Diploma
In terms of high school diploma, the demographic groups most similar to Immigrants from Cameroon are Crow (88.4%, a difference of 0.0%), Immigrants from Somalia (88.4%, a difference of 0.010%), Chickasaw (88.4%, a difference of 0.010%), Immigrants from Africa (88.4%, a difference of 0.010%), and Immigrants from Bolivia (88.4%, a difference of 0.030%).
| Demographics | Rating | Rank | High School Diploma |
| Immigrants | Sierra Leone | 15.8 /100 | #207 | Poor 88.6% |
| Portuguese | 14.4 /100 | #208 | Poor 88.5% |
| Cherokee | 14.3 /100 | #209 | Poor 88.5% |
| Samoans | 14.0 /100 | #210 | Poor 88.5% |
| Inupiat | 13.1 /100 | #211 | Poor 88.5% |
| South American Indians | 12.2 /100 | #212 | Poor 88.5% |
| Immigrants | Somalia | 11.3 /100 | #213 | Poor 88.4% |
| Immigrants | Cameroon | 10.9 /100 | #214 | Poor 88.4% |
| Crow | 10.9 /100 | #215 | Poor 88.4% |
| Chickasaw | 10.7 /100 | #216 | Poor 88.4% |
| Immigrants | Africa | 10.6 /100 | #217 | Poor 88.4% |
| Immigrants | Bolivia | 10.3 /100 | #218 | Poor 88.4% |
| Costa Ricans | 9.6 /100 | #219 | Tragic 88.4% |
| Tongans | 9.5 /100 | #220 | Tragic 88.4% |
| Immigrants | Afghanistan | 8.6 /100 | #221 | Tragic 88.3% |