Dominican vs Mongolian High School Diploma
COMPARE
Dominican
Mongolian
High School Diploma
High School Diploma Comparison
Dominicans
Mongolians
82.9%
HIGH SCHOOL DIPLOMA
0.0/ 100
METRIC RATING
328th/ 347
METRIC RANK
89.9%
HIGH SCHOOL DIPLOMA
91.6/ 100
METRIC RATING
124th/ 347
METRIC RANK
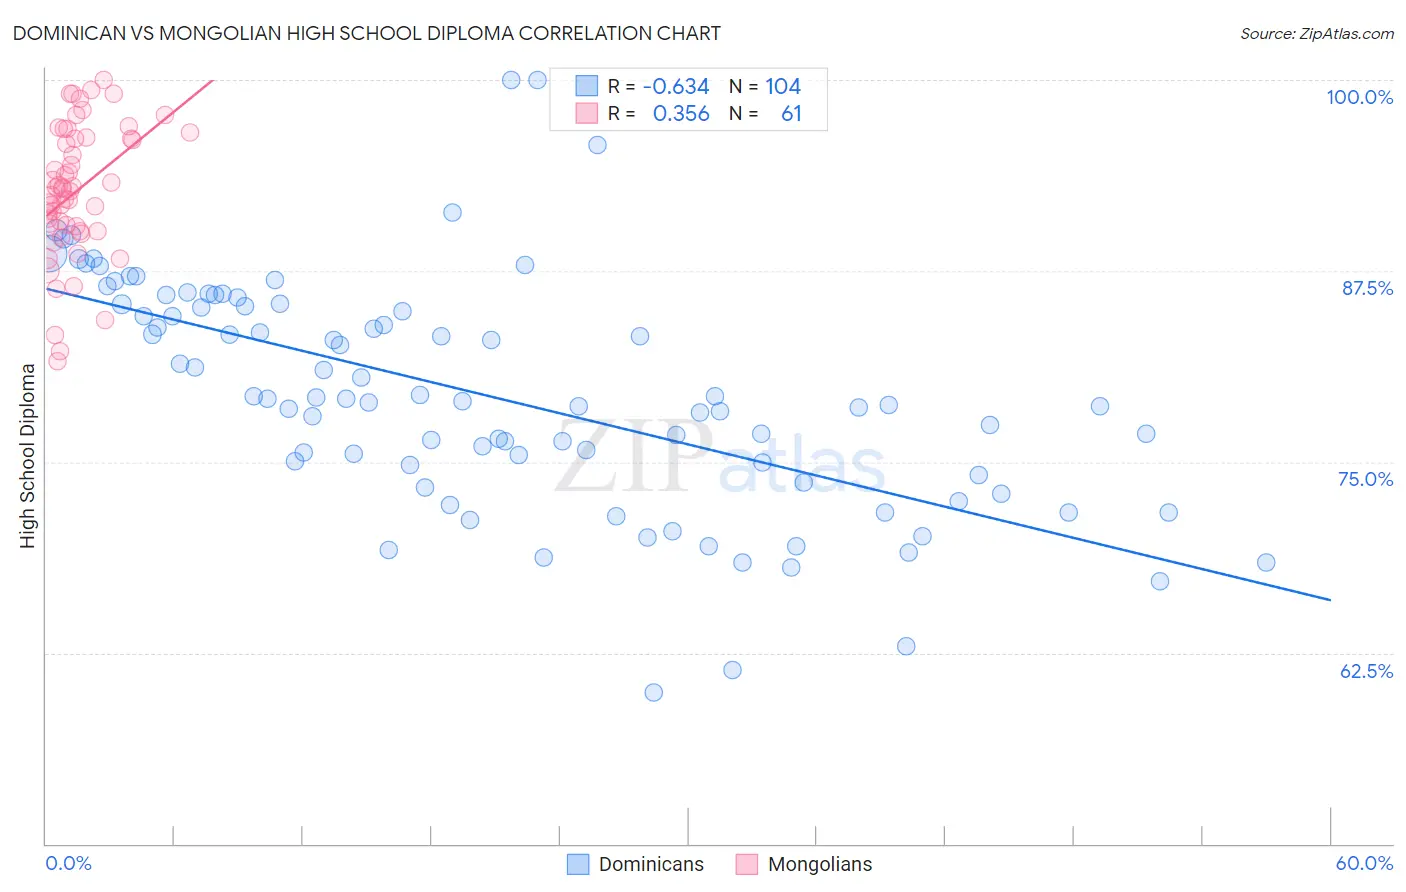
Dominican vs Mongolian High School Diploma Correlation Chart
The statistical analysis conducted on geographies consisting of 355,143,036 people shows a significant negative correlation between the proportion of Dominicans and percentage of population with at least high school diploma education in the United States with a correlation coefficient (R) of -0.634 and weighted average of 82.9%. Similarly, the statistical analysis conducted on geographies consisting of 140,362,004 people shows a mild positive correlation between the proportion of Mongolians and percentage of population with at least high school diploma education in the United States with a correlation coefficient (R) of 0.356 and weighted average of 89.9%, a difference of 8.4%.
High School Diploma Correlation Summary
| Measurement | Dominican | Mongolian |
| Minimum | 59.9% | 81.6% |
| Maximum | 100.0% | 100.0% |
| Range | 40.1% | 18.4% |
| Mean | 79.4% | 92.7% |
| Median | 79.0% | 92.8% |
| Interquartile 25% (IQ1) | 74.5% | 90.2% |
| Interquartile 75% (IQ3) | 85.3% | 96.2% |
| Interquartile Range (IQR) | 10.8% | 6.0% |
| Standard Deviation (Sample) | 7.6% | 4.3% |
| Standard Deviation (Population) | 7.6% | 4.3% |
Similar Demographics by High School Diploma
Demographics Similar to Dominicans by High School Diploma
In terms of high school diploma, the demographic groups most similar to Dominicans are Honduran (83.0%, a difference of 0.050%), Mexican American Indian (83.0%, a difference of 0.090%), Hispanic or Latino (82.9%, a difference of 0.10%), Immigrants from Nicaragua (83.1%, a difference of 0.16%), and Immigrants from the Azores (82.8%, a difference of 0.17%).
| Demographics | Rating | Rank | High School Diploma |
| Yuman | 0.0 /100 | #321 | Tragic 84.0% |
| Lumbee | 0.0 /100 | #322 | Tragic 83.6% |
| Immigrants | Cuba | 0.0 /100 | #323 | Tragic 83.5% |
| Immigrants | Cabo Verde | 0.0 /100 | #324 | Tragic 83.3% |
| Immigrants | Nicaragua | 0.0 /100 | #325 | Tragic 83.1% |
| Mexican American Indians | 0.0 /100 | #326 | Tragic 83.0% |
| Hondurans | 0.0 /100 | #327 | Tragic 83.0% |
| Dominicans | 0.0 /100 | #328 | Tragic 82.9% |
| Hispanics or Latinos | 0.0 /100 | #329 | Tragic 82.9% |
| Immigrants | Azores | 0.0 /100 | #330 | Tragic 82.8% |
| Central Americans | 0.0 /100 | #331 | Tragic 82.5% |
| Immigrants | Honduras | 0.0 /100 | #332 | Tragic 82.5% |
| Immigrants | Latin America | 0.0 /100 | #333 | Tragic 82.1% |
| Tohono O'odham | 0.0 /100 | #334 | Tragic 82.1% |
| Guatemalans | 0.0 /100 | #335 | Tragic 82.0% |
Demographics Similar to Mongolians by High School Diploma
In terms of high school diploma, the demographic groups most similar to Mongolians are German Russian (90.0%, a difference of 0.020%), Egyptian (89.9%, a difference of 0.020%), Alaska Native (89.9%, a difference of 0.030%), Immigrants from Kazakhstan (90.0%, a difference of 0.10%), and Immigrants from Eastern Asia (89.9%, a difference of 0.10%).
| Demographics | Rating | Rank | High School Diploma |
| Jordanians | 95.4 /100 | #117 | Exceptional 90.2% |
| Israelis | 95.1 /100 | #118 | Exceptional 90.1% |
| Immigrants | Eastern Europe | 94.9 /100 | #119 | Exceptional 90.1% |
| Ottawa | 94.4 /100 | #120 | Exceptional 90.1% |
| Whites/Caucasians | 94.1 /100 | #121 | Exceptional 90.1% |
| Immigrants | Kazakhstan | 93.4 /100 | #122 | Exceptional 90.0% |
| German Russians | 92.0 /100 | #123 | Exceptional 90.0% |
| Mongolians | 91.6 /100 | #124 | Exceptional 89.9% |
| Egyptians | 91.1 /100 | #125 | Exceptional 89.9% |
| Alaska Natives | 91.0 /100 | #126 | Exceptional 89.9% |
| Immigrants | Eastern Asia | 89.2 /100 | #127 | Excellent 89.9% |
| Puget Sound Salish | 89.1 /100 | #128 | Excellent 89.9% |
| Basques | 88.5 /100 | #129 | Excellent 89.8% |
| Immigrants | Ukraine | 87.9 /100 | #130 | Excellent 89.8% |
| Immigrants | Italy | 87.4 /100 | #131 | Excellent 89.8% |