Dominican vs Immigrants from Pakistan High School Diploma
COMPARE
Dominican
Immigrants from Pakistan
High School Diploma
High School Diploma Comparison
Dominicans
Immigrants from Pakistan
82.9%
HIGH SCHOOL DIPLOMA
0.0/ 100
METRIC RATING
328th/ 347
METRIC RANK
89.3%
HIGH SCHOOL DIPLOMA
62.5/ 100
METRIC RATING
158th/ 347
METRIC RANK
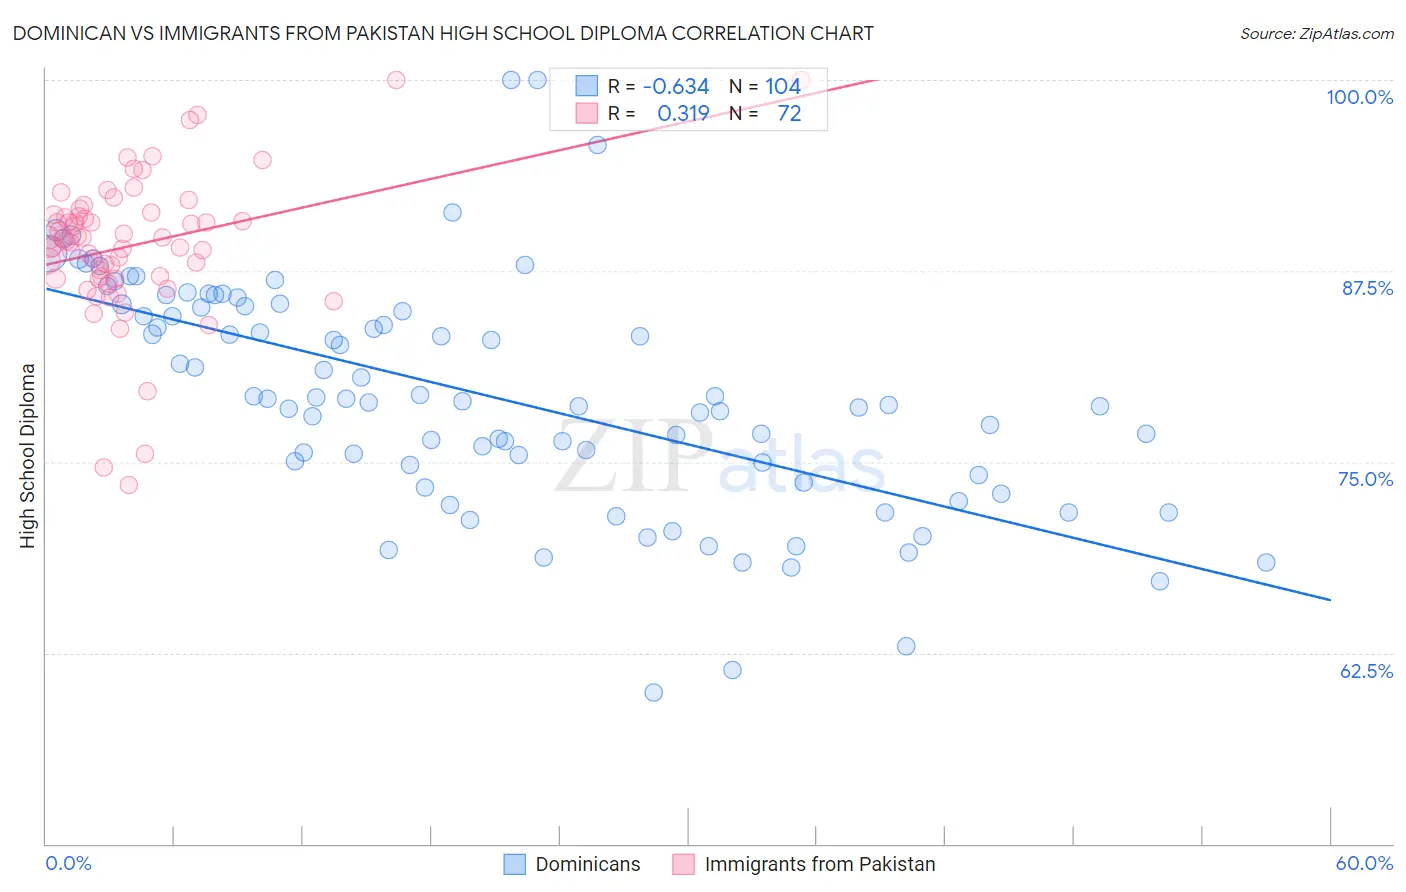
Dominican vs Immigrants from Pakistan High School Diploma Correlation Chart
The statistical analysis conducted on geographies consisting of 355,143,036 people shows a significant negative correlation between the proportion of Dominicans and percentage of population with at least high school diploma education in the United States with a correlation coefficient (R) of -0.634 and weighted average of 82.9%. Similarly, the statistical analysis conducted on geographies consisting of 283,913,061 people shows a mild positive correlation between the proportion of Immigrants from Pakistan and percentage of population with at least high school diploma education in the United States with a correlation coefficient (R) of 0.319 and weighted average of 89.3%, a difference of 7.7%.
High School Diploma Correlation Summary
| Measurement | Dominican | Immigrants from Pakistan |
| Minimum | 59.9% | 73.5% |
| Maximum | 100.0% | 100.0% |
| Range | 40.1% | 26.5% |
| Mean | 79.4% | 89.2% |
| Median | 79.0% | 89.5% |
| Interquartile 25% (IQ1) | 74.5% | 87.1% |
| Interquartile 75% (IQ3) | 85.3% | 91.1% |
| Interquartile Range (IQR) | 10.8% | 4.1% |
| Standard Deviation (Sample) | 7.6% | 4.7% |
| Standard Deviation (Population) | 7.6% | 4.7% |
Similar Demographics by High School Diploma
Demographics Similar to Dominicans by High School Diploma
In terms of high school diploma, the demographic groups most similar to Dominicans are Honduran (83.0%, a difference of 0.050%), Mexican American Indian (83.0%, a difference of 0.090%), Hispanic or Latino (82.9%, a difference of 0.10%), Immigrants from Nicaragua (83.1%, a difference of 0.16%), and Immigrants from the Azores (82.8%, a difference of 0.17%).
| Demographics | Rating | Rank | High School Diploma |
| Yuman | 0.0 /100 | #321 | Tragic 84.0% |
| Lumbee | 0.0 /100 | #322 | Tragic 83.6% |
| Immigrants | Cuba | 0.0 /100 | #323 | Tragic 83.5% |
| Immigrants | Cabo Verde | 0.0 /100 | #324 | Tragic 83.3% |
| Immigrants | Nicaragua | 0.0 /100 | #325 | Tragic 83.1% |
| Mexican American Indians | 0.0 /100 | #326 | Tragic 83.0% |
| Hondurans | 0.0 /100 | #327 | Tragic 83.0% |
| Dominicans | 0.0 /100 | #328 | Tragic 82.9% |
| Hispanics or Latinos | 0.0 /100 | #329 | Tragic 82.9% |
| Immigrants | Azores | 0.0 /100 | #330 | Tragic 82.8% |
| Central Americans | 0.0 /100 | #331 | Tragic 82.5% |
| Immigrants | Honduras | 0.0 /100 | #332 | Tragic 82.5% |
| Immigrants | Latin America | 0.0 /100 | #333 | Tragic 82.1% |
| Tohono O'odham | 0.0 /100 | #334 | Tragic 82.1% |
| Guatemalans | 0.0 /100 | #335 | Tragic 82.0% |
Demographics Similar to Immigrants from Pakistan by High School Diploma
In terms of high school diploma, the demographic groups most similar to Immigrants from Pakistan are Immigrants from China (89.3%, a difference of 0.010%), Laotian (89.3%, a difference of 0.010%), Immigrants from Malaysia (89.3%, a difference of 0.020%), Brazilian (89.3%, a difference of 0.020%), and Bermudan (89.3%, a difference of 0.020%).
| Demographics | Rating | Rank | High School Diploma |
| Paraguayans | 71.4 /100 | #151 | Good 89.5% |
| Asians | 70.7 /100 | #152 | Good 89.4% |
| Immigrants | Iraq | 68.7 /100 | #153 | Good 89.4% |
| Alsatians | 66.8 /100 | #154 | Good 89.4% |
| Immigrants | Northern Africa | 66.4 /100 | #155 | Good 89.4% |
| Immigrants | Argentina | 65.5 /100 | #156 | Good 89.4% |
| Immigrants | Malaysia | 63.5 /100 | #157 | Good 89.3% |
| Immigrants | Pakistan | 62.5 /100 | #158 | Good 89.3% |
| Immigrants | China | 62.0 /100 | #159 | Good 89.3% |
| Laotians | 61.8 /100 | #160 | Good 89.3% |
| Brazilians | 61.2 /100 | #161 | Good 89.3% |
| Bermudans | 61.1 /100 | #162 | Good 89.3% |
| Cree | 61.1 /100 | #163 | Good 89.3% |
| Immigrants | Nepal | 61.1 /100 | #164 | Good 89.3% |
| Immigrants | Asia | 59.8 /100 | #165 | Average 89.3% |