Black/African American vs Cheyenne High School Diploma
COMPARE
Black/African American
Cheyenne
High School Diploma
High School Diploma Comparison
Blacks/African Americans
Cheyenne
87.0%
HIGH SCHOOL DIPLOMA
0.2/ 100
METRIC RATING
267th/ 347
METRIC RANK
87.8%
HIGH SCHOOL DIPLOMA
2.1/ 100
METRIC RATING
242nd/ 347
METRIC RANK
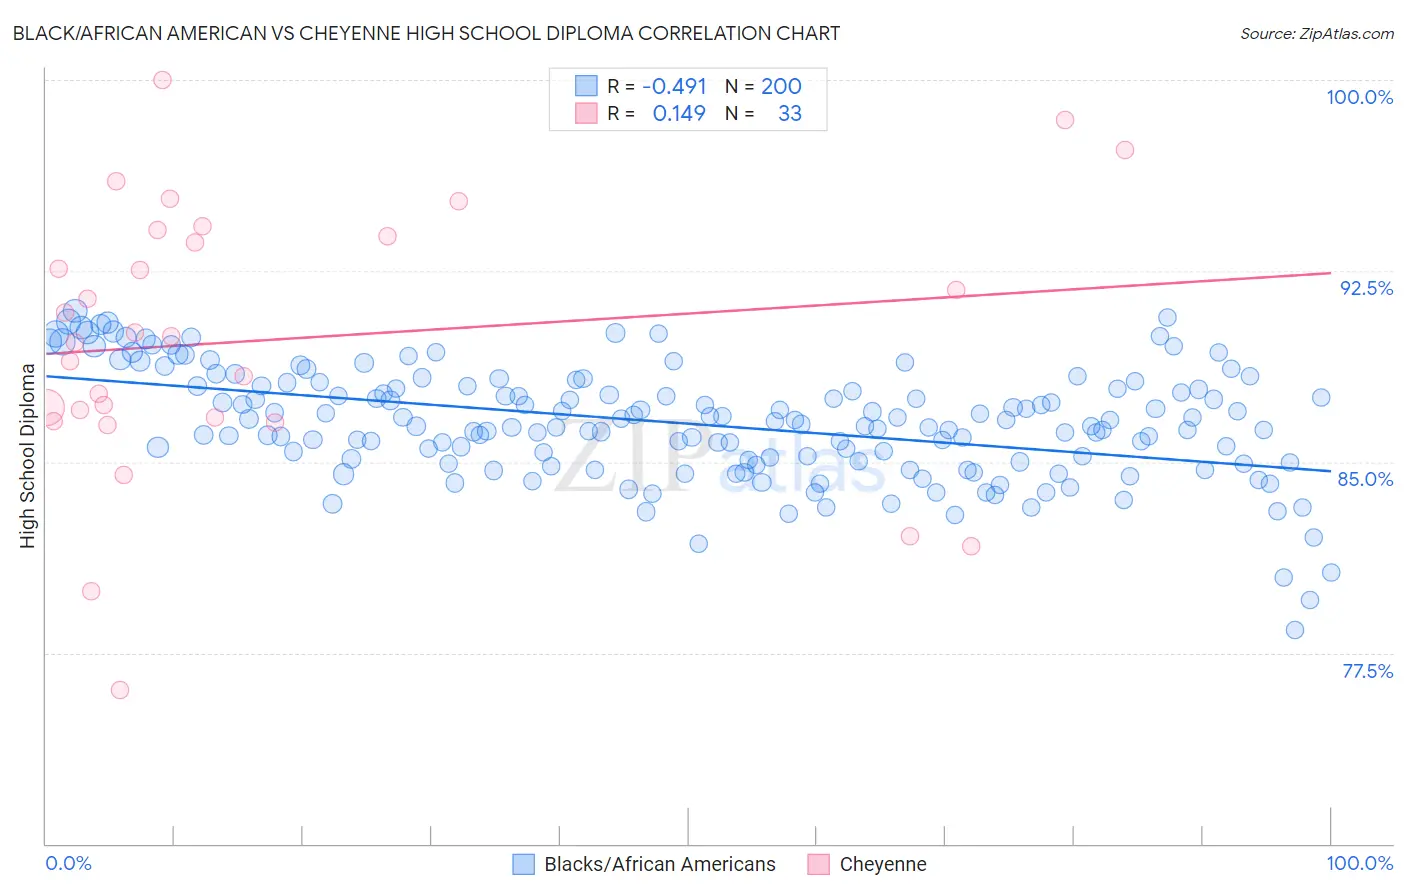
Black/African American vs Cheyenne High School Diploma Correlation Chart
The statistical analysis conducted on geographies consisting of 566,048,038 people shows a moderate negative correlation between the proportion of Blacks/African Americans and percentage of population with at least high school diploma education in the United States with a correlation coefficient (R) of -0.491 and weighted average of 87.0%. Similarly, the statistical analysis conducted on geographies consisting of 80,719,287 people shows a poor positive correlation between the proportion of Cheyenne and percentage of population with at least high school diploma education in the United States with a correlation coefficient (R) of 0.149 and weighted average of 87.8%, a difference of 0.93%.
High School Diploma Correlation Summary
| Measurement | Black/African American | Cheyenne |
| Minimum | 78.4% | 76.1% |
| Maximum | 90.9% | 100.0% |
| Range | 12.5% | 23.9% |
| Mean | 86.5% | 89.8% |
| Median | 86.4% | 90.0% |
| Interquartile 25% (IQ1) | 85.0% | 86.7% |
| Interquartile 75% (IQ3) | 88.0% | 94.0% |
| Interquartile Range (IQR) | 3.0% | 7.3% |
| Standard Deviation (Sample) | 2.2% | 5.4% |
| Standard Deviation (Population) | 2.2% | 5.3% |
Similar Demographics by High School Diploma
Demographics Similar to Blacks/African Americans by High School Diploma
In terms of high school diploma, the demographic groups most similar to Blacks/African Americans are Immigrants from Congo (87.0%, a difference of 0.010%), Pennsylvania German (87.0%, a difference of 0.030%), Sri Lankan (87.0%, a difference of 0.040%), U.S. Virgin Islander (87.1%, a difference of 0.060%), and Malaysian (87.0%, a difference of 0.060%).
| Demographics | Rating | Rank | High School Diploma |
| Cajuns | 0.4 /100 | #260 | Tragic 87.3% |
| Seminole | 0.4 /100 | #261 | Tragic 87.3% |
| Immigrants | Peru | 0.4 /100 | #262 | Tragic 87.3% |
| Immigrants | South Eastern Asia | 0.3 /100 | #263 | Tragic 87.2% |
| Jamaicans | 0.3 /100 | #264 | Tragic 87.2% |
| U.S. Virgin Islanders | 0.2 /100 | #265 | Tragic 87.1% |
| Immigrants | Congo | 0.2 /100 | #266 | Tragic 87.0% |
| Blacks/African Americans | 0.2 /100 | #267 | Tragic 87.0% |
| Pennsylvania Germans | 0.2 /100 | #268 | Tragic 87.0% |
| Sri Lankans | 0.2 /100 | #269 | Tragic 87.0% |
| Malaysians | 0.2 /100 | #270 | Tragic 87.0% |
| West Indians | 0.1 /100 | #271 | Tragic 86.9% |
| Trinidadians and Tobagonians | 0.1 /100 | #272 | Tragic 86.9% |
| Immigrants | Jamaica | 0.1 /100 | #273 | Tragic 86.9% |
| Bangladeshis | 0.1 /100 | #274 | Tragic 86.9% |
Demographics Similar to Cheyenne by High School Diploma
In terms of high school diploma, the demographic groups most similar to Cheyenne are Immigrants from Uzbekistan (87.8%, a difference of 0.0%), Immigrants from Philippines (87.8%, a difference of 0.020%), Comanche (87.9%, a difference of 0.030%), Choctaw (87.8%, a difference of 0.030%), and Peruvian (87.8%, a difference of 0.040%).
| Demographics | Rating | Rank | High School Diploma |
| Immigrants | Bahamas | 2.9 /100 | #235 | Tragic 88.0% |
| Sub-Saharan Africans | 2.8 /100 | #236 | Tragic 87.9% |
| Taiwanese | 2.8 /100 | #237 | Tragic 87.9% |
| Sioux | 2.7 /100 | #238 | Tragic 87.9% |
| South Americans | 2.7 /100 | #239 | Tragic 87.9% |
| Comanche | 2.2 /100 | #240 | Tragic 87.9% |
| Immigrants | Uzbekistan | 2.1 /100 | #241 | Tragic 87.8% |
| Cheyenne | 2.1 /100 | #242 | Tragic 87.8% |
| Immigrants | Philippines | 1.9 /100 | #243 | Tragic 87.8% |
| Choctaw | 1.9 /100 | #244 | Tragic 87.8% |
| Peruvians | 1.9 /100 | #245 | Tragic 87.8% |
| Immigrants | Eritrea | 1.7 /100 | #246 | Tragic 87.8% |
| Immigrants | Costa Rica | 1.7 /100 | #247 | Tragic 87.8% |
| Spanish Americans | 1.5 /100 | #248 | Tragic 87.7% |
| Senegalese | 1.5 /100 | #249 | Tragic 87.7% |