Dominican vs Immigrants from Uganda High School Diploma
COMPARE
Dominican
Immigrants from Uganda
High School Diploma
High School Diploma Comparison
Dominicans
Immigrants from Uganda
82.9%
HIGH SCHOOL DIPLOMA
0.0/ 100
METRIC RATING
328th/ 347
METRIC RANK
88.9%
HIGH SCHOOL DIPLOMA
32.6/ 100
METRIC RATING
189th/ 347
METRIC RANK
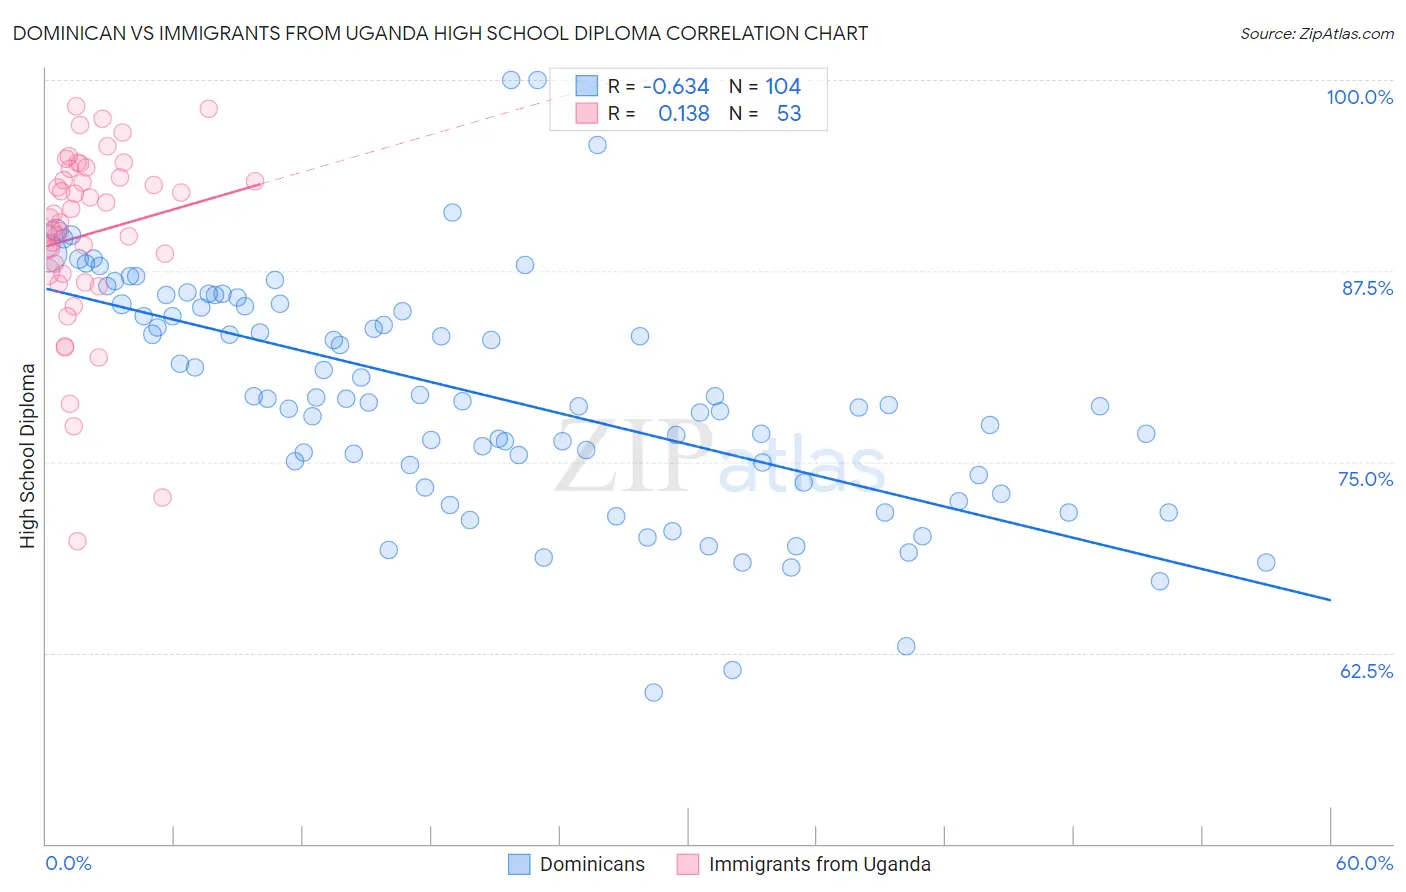
Dominican vs Immigrants from Uganda High School Diploma Correlation Chart
The statistical analysis conducted on geographies consisting of 355,143,036 people shows a significant negative correlation between the proportion of Dominicans and percentage of population with at least high school diploma education in the United States with a correlation coefficient (R) of -0.634 and weighted average of 82.9%. Similarly, the statistical analysis conducted on geographies consisting of 125,981,524 people shows a poor positive correlation between the proportion of Immigrants from Uganda and percentage of population with at least high school diploma education in the United States with a correlation coefficient (R) of 0.138 and weighted average of 88.9%, a difference of 7.2%.
High School Diploma Correlation Summary
| Measurement | Dominican | Immigrants from Uganda |
| Minimum | 59.9% | 69.8% |
| Maximum | 100.0% | 98.3% |
| Range | 40.1% | 28.5% |
| Mean | 79.4% | 89.9% |
| Median | 79.0% | 91.0% |
| Interquartile 25% (IQ1) | 74.5% | 87.4% |
| Interquartile 75% (IQ3) | 85.3% | 93.9% |
| Interquartile Range (IQR) | 10.8% | 6.5% |
| Standard Deviation (Sample) | 7.6% | 6.0% |
| Standard Deviation (Population) | 7.6% | 5.9% |
Similar Demographics by High School Diploma
Demographics Similar to Dominicans by High School Diploma
In terms of high school diploma, the demographic groups most similar to Dominicans are Honduran (83.0%, a difference of 0.050%), Mexican American Indian (83.0%, a difference of 0.090%), Hispanic or Latino (82.9%, a difference of 0.10%), Immigrants from Nicaragua (83.1%, a difference of 0.16%), and Immigrants from the Azores (82.8%, a difference of 0.17%).
| Demographics | Rating | Rank | High School Diploma |
| Yuman | 0.0 /100 | #321 | Tragic 84.0% |
| Lumbee | 0.0 /100 | #322 | Tragic 83.6% |
| Immigrants | Cuba | 0.0 /100 | #323 | Tragic 83.5% |
| Immigrants | Cabo Verde | 0.0 /100 | #324 | Tragic 83.3% |
| Immigrants | Nicaragua | 0.0 /100 | #325 | Tragic 83.1% |
| Mexican American Indians | 0.0 /100 | #326 | Tragic 83.0% |
| Hondurans | 0.0 /100 | #327 | Tragic 83.0% |
| Dominicans | 0.0 /100 | #328 | Tragic 82.9% |
| Hispanics or Latinos | 0.0 /100 | #329 | Tragic 82.9% |
| Immigrants | Azores | 0.0 /100 | #330 | Tragic 82.8% |
| Central Americans | 0.0 /100 | #331 | Tragic 82.5% |
| Immigrants | Honduras | 0.0 /100 | #332 | Tragic 82.5% |
| Immigrants | Latin America | 0.0 /100 | #333 | Tragic 82.1% |
| Tohono O'odham | 0.0 /100 | #334 | Tragic 82.1% |
| Guatemalans | 0.0 /100 | #335 | Tragic 82.0% |
Demographics Similar to Immigrants from Uganda by High School Diploma
In terms of high school diploma, the demographic groups most similar to Immigrants from Uganda are Immigrants from Sudan (88.9%, a difference of 0.010%), Immigrants from Chile (88.9%, a difference of 0.010%), Immigrants from Ethiopia (88.9%, a difference of 0.030%), Immigrants from Eastern Africa (88.9%, a difference of 0.050%), and Guamanian/Chamorro (88.9%, a difference of 0.050%).
| Demographics | Rating | Rank | High School Diploma |
| Spaniards | 43.4 /100 | #182 | Average 89.1% |
| Potawatomi | 42.5 /100 | #183 | Average 89.0% |
| Immigrants | Syria | 39.2 /100 | #184 | Fair 89.0% |
| Ethiopians | 37.0 /100 | #185 | Fair 89.0% |
| Immigrants | Eastern Africa | 35.8 /100 | #186 | Fair 88.9% |
| Guamanians/Chamorros | 35.5 /100 | #187 | Fair 88.9% |
| Immigrants | Sudan | 33.4 /100 | #188 | Fair 88.9% |
| Immigrants | Uganda | 32.6 /100 | #189 | Fair 88.9% |
| Immigrants | Chile | 31.9 /100 | #190 | Fair 88.9% |
| Immigrants | Ethiopia | 30.9 /100 | #191 | Fair 88.9% |
| Moroccans | 29.5 /100 | #192 | Fair 88.8% |
| Immigrants | Oceania | 26.9 /100 | #193 | Fair 88.8% |
| Immigrants | Venezuela | 25.8 /100 | #194 | Fair 88.8% |
| Afghans | 23.9 /100 | #195 | Fair 88.8% |
| Immigrants | Southern Europe | 23.4 /100 | #196 | Fair 88.7% |