Asian vs Cheyenne High School Diploma

COMPARE

Asian
Race
Ancestry
AfghanAfricanAlaska NativeAlaskan AthabascanAlbanianAleutAlsatianAmericanApacheArabArapahoArgentineanArmenianAssyrian/Chaldean/SyriacAustralianAustrianBahamianBangladeshiBarbadianBasqueBelgianBelizeanBermudanBhutaneseBlackfeetBolivianBrazilianBritishBritish West IndianBulgarianBurmeseCajunCambodianCanadianCape VerdeanCarpatho RusynCelticCentral AmericanCentral American IndianCherokeeChickasawChileanChineseChippewaChoctawColombianColvilleComancheCosta RicanCreeCreekCroatianCrowCubanCypriotCzechCzechoslovakianDanishDelawareDominicanDutchDutch West IndianEastern EuropeanEcuadorianEgyptianEnglishEstonianEthiopianEuropeanFijianFilipinoFinnishFrenchFrench American IndianFrench CanadianGermanGerman RussianGhanaianGreekGuamanian/ChamorroGuatemalanGuyaneseHaitianHmongHonduranHopiHoumaHungarianIcelanderIndian (Asian)IndonesianInupiatIranianIraqiIrishIroquoisIsraeliItalianJamaicanJapaneseJordanianKenyanKiowaKoreanLaotianLatvianLebaneseLiberianLithuanianLumbeeLuxembourgerMacedonianMalaysianMalteseMarshalleseMenomineeMexicanMexican American IndianMongolianMoroccanNative HawaiianNavajoNepaleseNew ZealanderNicaraguanNigerianNorthern EuropeanNorwegianOkinawanOsageOttawaPaiutePakistaniPalestinianPanamanianParaguayanPennsylvania GermanPeruvianPimaPolishPortuguesePotawatomiPuebloPuerto RicanPuget Sound SalishRomanianRussianSalvadoranSamoanScandinavianScotch-IrishScottishSeminoleSenegaleseSerbianShoshoneSierra LeoneanSiouxSlavicSlovakSloveneSomaliSouth AfricanSouth AmericanSouth American IndianSoviet UnionSpaniardSpanishSpanish AmericanSpanish American IndianSri LankanSubsaharan AfricanSudaneseSwedishSwissSyrianTaiwaneseThaiTlingit-HaidaTohono O'OdhamTonganTrinidadian and TobagonianTsimshianTurkishU.S. Virgin IslanderUgandanUkrainianUruguayanUteVenezuelanVietnameseWelshWest IndianYakamaYaquiYugoslavianYumanYup'ikZimbabwean
Immigration
NonimmigrantsImmigrantsAfghanistanAfricaAlbaniaArgentinaArmeniaAsiaAustraliaAustriaBahamasBangladeshBarbadosBelarusBelgiumBelizeBoliviaBosnia and HerzegovinaBrazilBulgariaBurma/MyanmarCabo VerdeCambodiaCameroonCanadaCaribbeanCentral AmericaChileChinaColombiaCongoCosta RicaCroatiaCubaCzechoslovakiaDenmarkDominicaDominican RepublicEastern AfricaEastern AsiaEastern EuropeEcuadorEgyptEl SalvadorEnglandEritreaEthiopiaEuropeFijiFranceGermanyGhanaGreeceGrenadaGuatemalaGuyanaHaitiHondurasHong KongHungaryIndiaIndonesiaIranIraqIrelandIsraelItalyJamaicaJapanJordanKazakhstanKenyaKoreaKuwaitLaosLatin AmericaLatviaLebanonLiberiaLithuaniaMalaysiaMexicoMicronesiaMiddle AfricaMoldovaMoroccoNepalNetherlandsNicaraguaNigeriaNorth AmericaNorth MacedoniaNorthern AfricaNorthern EuropeNorwayOceaniaPakistanPanamaPeruPhilippinesPolandPortugalRomaniaRussiaSaudi ArabiaScotlandSenegalSerbiaSierra LeoneSingaporeSomaliaSouth AfricaSouth AmericaSouth Central AsiaSouth Eastern AsiaSouthern EuropeSpainSri LankaSt. Vincent and the GrenadinesSudanSwedenSwitzerlandSyriaTaiwanThailandTrinidad and TobagoTurkeyUgandaUkraineUruguayUzbekistanVenezuelaVietnamWest IndiesWestern AfricaWestern AsiaWestern EuropeYemenZaireZimbabweAzores
Cheyenne
Race
Ancestry
AfghanAfricanAlaska NativeAlaskan AthabascanAlbanianAleutAlsatianAmericanApacheArabArapahoArgentineanArmenianAssyrian/Chaldean/SyriacAustralianAustrianBahamianBangladeshiBarbadianBasqueBelgianBelizeanBermudanBhutaneseBlackfeetBolivianBrazilianBritishBritish West IndianBulgarianBurmeseCajunCambodianCanadianCape VerdeanCarpatho RusynCelticCentral AmericanCentral American IndianCherokeeCheyenneChickasawChileanChineseChippewaChoctawColombianColvilleComancheCosta RicanCreeCreekCroatianCrowCubanCypriotCzechCzechoslovakianDanishDelawareDominicanDutchDutch West IndianEastern EuropeanEcuadorianEgyptianEnglishEstonianEthiopianEuropeanFijianFilipinoFinnishFrenchFrench American IndianFrench CanadianGermanGerman RussianGhanaianGreekGuamanian/ChamorroGuatemalanGuyaneseHaitianHmongHonduranHopiHoumaHungarianIcelanderIndian (Asian)IndonesianInupiatIranianIraqiIrishIroquoisIsraeliItalianJamaicanJapaneseJordanianKenyanKiowaKoreanLaotianLatvianLebaneseLiberianLithuanianLumbeeLuxembourgerMacedonianMalaysianMalteseMarshalleseMenomineeMexicanMexican American IndianMongolianMoroccanNative HawaiianNavajoNepaleseNew ZealanderNicaraguanNigerianNorthern EuropeanNorwegianOkinawanOsageOttawaPaiutePakistaniPalestinianPanamanianParaguayanPennsylvania GermanPeruvianPimaPolishPortuguesePotawatomiPuebloPuerto RicanPuget Sound SalishRomanianRussianSalvadoranSamoanScandinavianScotch-IrishScottishSeminoleSenegaleseSerbianShoshoneSierra LeoneanSiouxSlavicSlovakSloveneSomaliSouth AfricanSouth AmericanSouth American IndianSoviet UnionSpaniardSpanishSpanish AmericanSpanish American IndianSri LankanSubsaharan AfricanSudaneseSwedishSwissSyrianTaiwaneseThaiTlingit-HaidaTohono O'OdhamTonganTrinidadian and TobagonianTsimshianTurkishU.S. Virgin IslanderUgandanUkrainianUruguayanUteVenezuelanVietnameseWelshWest IndianYakamaYaquiYugoslavianYumanYup'ikZimbabwean
Immigration
NonimmigrantsImmigrantsAfghanistanAfricaAlbaniaArgentinaArmeniaAsiaAustraliaAustriaBahamasBangladeshBarbadosBelarusBelgiumBelizeBoliviaBosnia and HerzegovinaBrazilBulgariaBurma/MyanmarCabo VerdeCambodiaCameroonCanadaCaribbeanCentral AmericaChileChinaColombiaCongoCosta RicaCroatiaCubaCzechoslovakiaDenmarkDominicaDominican RepublicEastern AfricaEastern AsiaEastern EuropeEcuadorEgyptEl SalvadorEnglandEritreaEthiopiaEuropeFijiFranceGermanyGhanaGreeceGrenadaGuatemalaGuyanaHaitiHondurasHong KongHungaryIndiaIndonesiaIranIraqIrelandIsraelItalyJamaicaJapanJordanKazakhstanKenyaKoreaKuwaitLaosLatin AmericaLatviaLebanonLiberiaLithuaniaMalaysiaMexicoMicronesiaMiddle AfricaMoldovaMoroccoNepalNetherlandsNicaraguaNigeriaNorth AmericaNorth MacedoniaNorthern AfricaNorthern EuropeNorwayOceaniaPakistanPanamaPeruPhilippinesPolandPortugalRomaniaRussiaSaudi ArabiaScotlandSenegalSerbiaSierra LeoneSingaporeSomaliaSouth AfricaSouth AmericaSouth Central AsiaSouth Eastern AsiaSouthern EuropeSpainSri LankaSt. Vincent and the GrenadinesSudanSwedenSwitzerlandSyriaTaiwanThailandTrinidad and TobagoTurkeyUgandaUkraineUruguayUzbekistanVenezuelaVietnamWest IndiesWestern AfricaWestern AsiaWestern EuropeYemenZaireZimbabweAzores
High School Diploma
Income
Poverty
Unemployment
Labor Participation
Family Structure
Vehicle Availability
Education Level
Disability

High School Diploma Comparison

Asians

Cheyenne

Good
Tragic
89.4%
HIGH SCHOOL DIPLOMA
70.7/ 100
METRIC RATING
152nd/ 347
METRIC RANK
87.8%
HIGH SCHOOL DIPLOMA
2.1/ 100
METRIC RATING
242nd/ 347
METRIC RANK

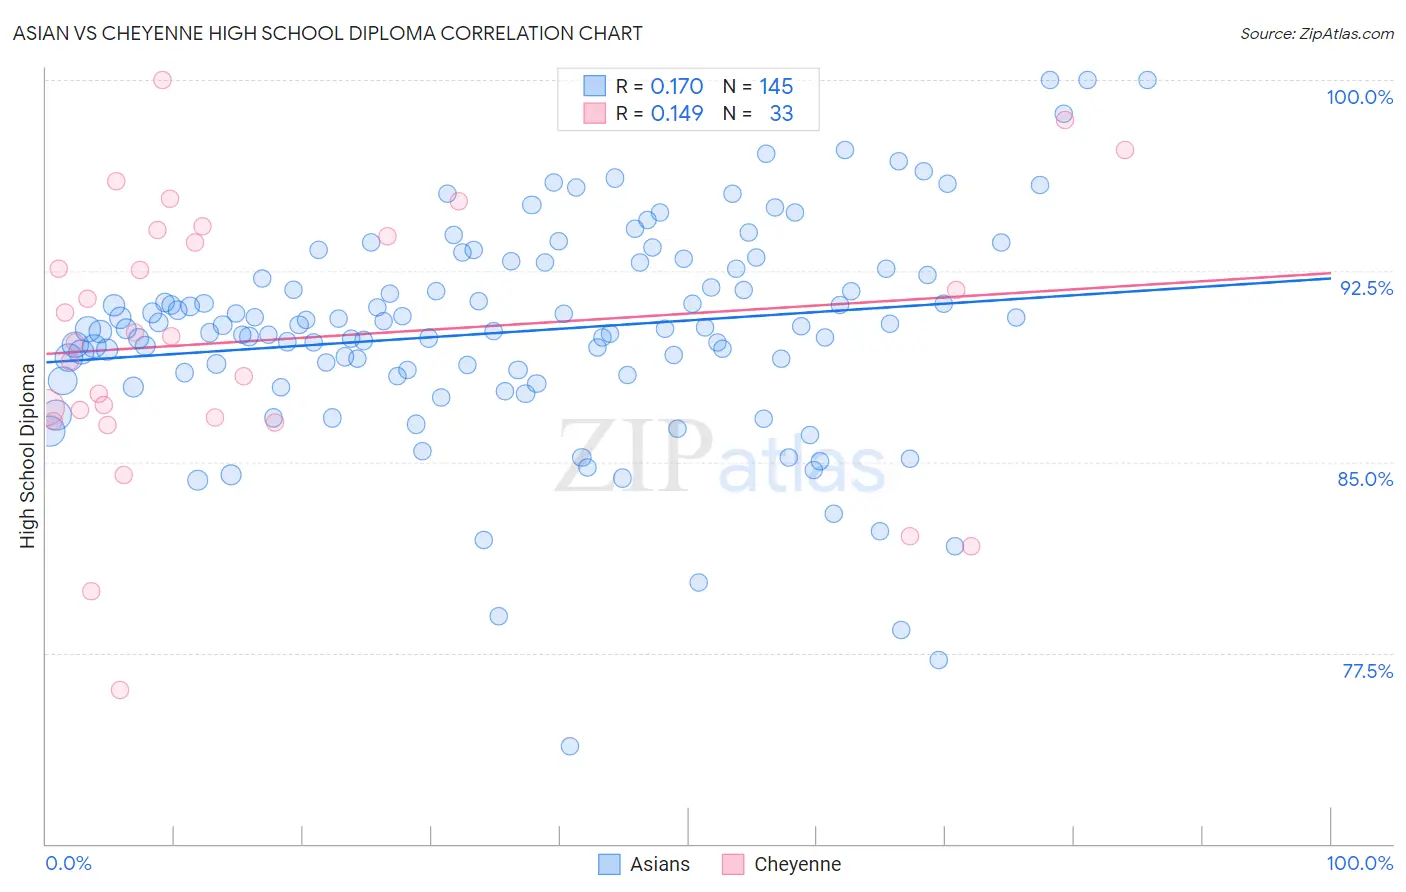
Asian vs Cheyenne High School Diploma Correlation Chart

The statistical analysis conducted on geographies consisting of 550,718,935 people shows a poor positive correlation between the proportion of Asians and percentage of population with at least high school diploma education in the United States with a correlation coefficient (R) of 0.170 and weighted average of 89.4%. Similarly, the statistical analysis conducted on geographies consisting of 80,719,287 people shows a poor positive correlation between the proportion of Cheyenne and percentage of population with at least high school diploma education in the United States with a correlation coefficient (R) of 0.149 and weighted average of 87.8%, a difference of 1.8%.
Asian vs Cheyenne High School Diploma

High School Diploma Correlation Summary

MeasurementAsianCheyenne
Minimum73.8%76.1%
Maximum100.0%100.0%
Range26.2%23.9%
Mean90.1%89.8%
Median90.2%90.0%
Interquartile 25% (IQ1)88.5%86.7%
Interquartile 75% (IQ3)92.6%94.0%
Interquartile Range (IQR)4.1%7.3%
Standard Deviation (Sample)4.2%5.4%
Standard Deviation (Population)4.2%5.3%

Similar Demographics by High School Diploma

Demographics Similar to Asians by High School Diploma

In terms of high school diploma, the demographic groups most similar to Asians are Paraguayan (89.5%, a difference of 0.010%), Argentinean (89.5%, a difference of 0.030%), Immigrants from Poland (89.5%, a difference of 0.040%), Immigrants from Iraq (89.4%, a difference of 0.040%), and Immigrants from Lebanon (89.5%, a difference of 0.050%).
DemographicsRating | RankHigh School Diploma
Immigrants | Brazil
76.6
/100
|
#145
Good
89.5%
Immigrants | Spain
76.2
/100
|
#146
Good
89.5%
Iraqis
73.9
/100
|
#147
Good
89.5%
Immigrants | Lebanon
73.4
/100
|
#148
Good
89.5%
Immigrants | Poland
72.9
/100
|
#149
Good
89.5%
Argentineans
72.3
/100
|
#150
Good
89.5%
Paraguayans
71.4
/100
|
#151
Good
89.5%
Asians
70.7
/100
|
#152
Good
89.4%
Immigrants | Iraq
68.7
/100
|
#153
Good
89.4%
Alsatians
66.8
/100
|
#154
Good
89.4%
Immigrants | Northern Africa
66.4
/100
|
#155
Good
89.4%
Immigrants | Argentina
65.5
/100
|
#156
Good
89.4%
Immigrants | Malaysia
63.5
/100
|
#157
Good
89.3%
Immigrants | Pakistan
62.5
/100
|
#158
Good
89.3%
Immigrants | China
62.0
/100
|
#159
Good
89.3%

Demographics Similar to Cheyenne by High School Diploma

In terms of high school diploma, the demographic groups most similar to Cheyenne are Immigrants from Uzbekistan (87.8%, a difference of 0.0%), Immigrants from Philippines (87.8%, a difference of 0.020%), Comanche (87.9%, a difference of 0.030%), Choctaw (87.8%, a difference of 0.030%), and Peruvian (87.8%, a difference of 0.040%).
DemographicsRating | RankHigh School Diploma
Immigrants | Bahamas
2.9
/100
|
#235
Tragic
88.0%
Sub-Saharan Africans
2.8
/100
|
#236
Tragic
87.9%
Taiwanese
2.8
/100
|
#237
Tragic
87.9%
Sioux
2.7
/100
|
#238
Tragic
87.9%
South Americans
2.7
/100
|
#239
Tragic
87.9%
Comanche
2.2
/100
|
#240
Tragic
87.9%
Immigrants | Uzbekistan
2.1
/100
|
#241
Tragic
87.8%
Cheyenne
2.1
/100
|
#242
Tragic
87.8%
Immigrants | Philippines
1.9
/100
|
#243
Tragic
87.8%
Choctaw
1.9
/100
|
#244
Tragic
87.8%
Peruvians
1.9
/100
|
#245
Tragic
87.8%
Immigrants | Eritrea
1.7
/100
|
#246
Tragic
87.8%
Immigrants | Costa Rica
1.7
/100
|
#247
Tragic
87.8%
Spanish Americans
1.5
/100
|
#248
Tragic
87.7%
Senegalese
1.5
/100
|
#249
Tragic
87.7%