Yugoslavian vs Cheyenne High School Diploma
COMPARE
Yugoslavian
Cheyenne
High School Diploma
High School Diploma Comparison
Yugoslavians
Cheyenne
90.2%
HIGH SCHOOL DIPLOMA
96.2/ 100
METRIC RATING
114th/ 347
METRIC RANK
87.8%
HIGH SCHOOL DIPLOMA
2.1/ 100
METRIC RATING
242nd/ 347
METRIC RANK
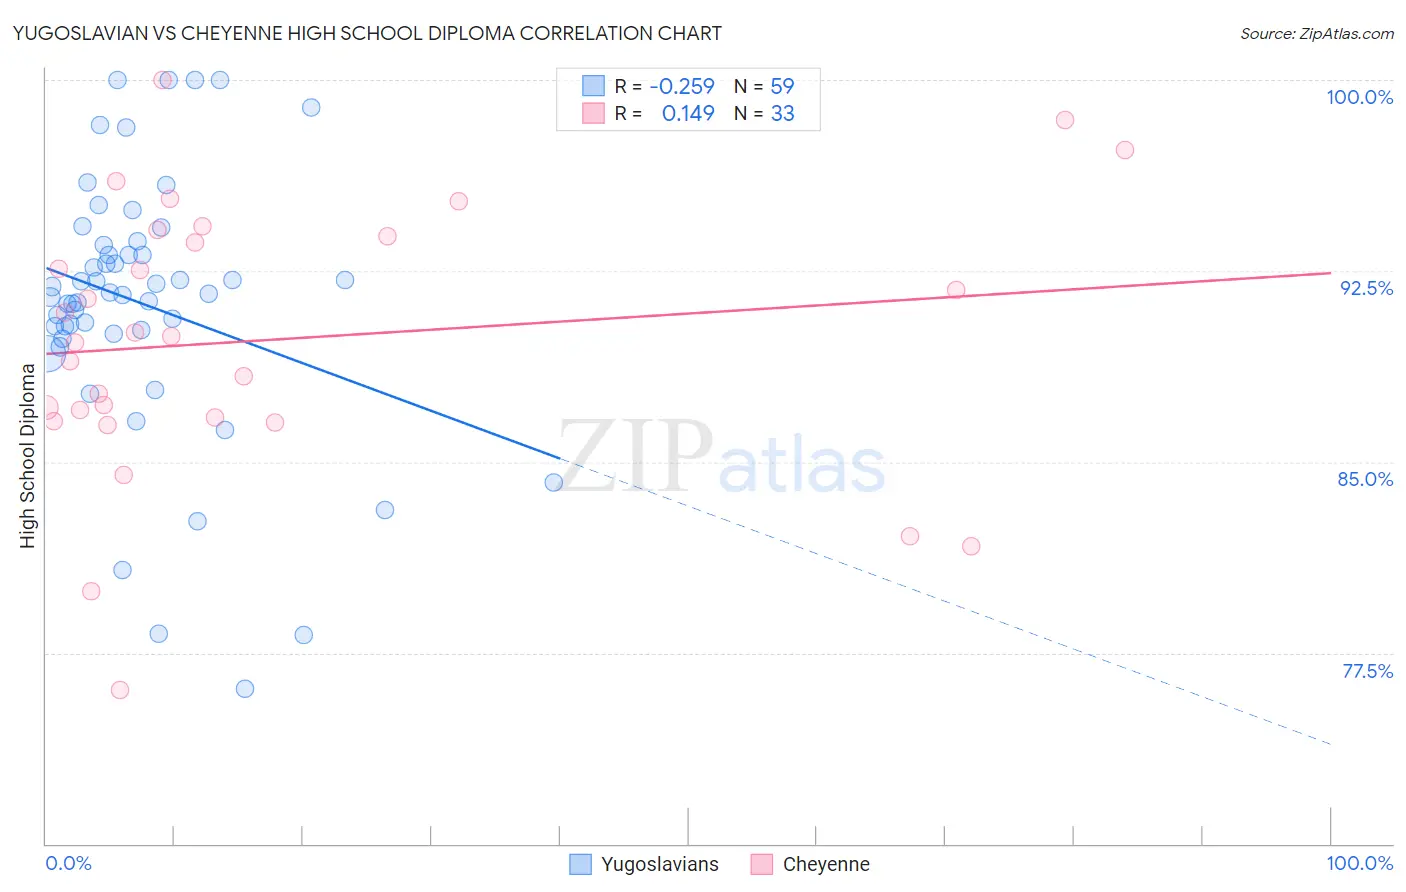
Yugoslavian vs Cheyenne High School Diploma Correlation Chart
The statistical analysis conducted on geographies consisting of 285,719,638 people shows a weak negative correlation between the proportion of Yugoslavians and percentage of population with at least high school diploma education in the United States with a correlation coefficient (R) of -0.259 and weighted average of 90.2%. Similarly, the statistical analysis conducted on geographies consisting of 80,719,287 people shows a poor positive correlation between the proportion of Cheyenne and percentage of population with at least high school diploma education in the United States with a correlation coefficient (R) of 0.149 and weighted average of 87.8%, a difference of 2.7%.
High School Diploma Correlation Summary
| Measurement | Yugoslavian | Cheyenne |
| Minimum | 76.1% | 76.1% |
| Maximum | 100.0% | 100.0% |
| Range | 23.9% | 23.9% |
| Mean | 91.2% | 89.8% |
| Median | 91.6% | 90.0% |
| Interquartile 25% (IQ1) | 90.0% | 86.7% |
| Interquartile 75% (IQ3) | 93.5% | 94.0% |
| Interquartile Range (IQR) | 3.5% | 7.3% |
| Standard Deviation (Sample) | 5.2% | 5.4% |
| Standard Deviation (Population) | 5.1% | 5.3% |
Similar Demographics by High School Diploma
Demographics Similar to Yugoslavians by High School Diploma
In terms of high school diploma, the demographic groups most similar to Yugoslavians are Immigrants from Sri Lanka (90.2%, a difference of 0.010%), Immigrants from Belarus (90.2%, a difference of 0.020%), Immigrants from Greece (90.3%, a difference of 0.040%), Menominee (90.3%, a difference of 0.040%), and Immigrants from Hungary (90.2%, a difference of 0.040%).
| Demographics | Rating | Rank | High School Diploma |
| Immigrants | Russia | 96.9 /100 | #107 | Exceptional 90.3% |
| Palestinians | 96.7 /100 | #108 | Exceptional 90.3% |
| Immigrants | Zimbabwe | 96.7 /100 | #109 | Exceptional 90.3% |
| Immigrants | Greece | 96.6 /100 | #110 | Exceptional 90.3% |
| Menominee | 96.6 /100 | #111 | Exceptional 90.3% |
| Immigrants | Belarus | 96.4 /100 | #112 | Exceptional 90.2% |
| Immigrants | Sri Lanka | 96.3 /100 | #113 | Exceptional 90.2% |
| Yugoslavians | 96.2 /100 | #114 | Exceptional 90.2% |
| Immigrants | Hungary | 95.8 /100 | #115 | Exceptional 90.2% |
| Immigrants | Germany | 95.7 /100 | #116 | Exceptional 90.2% |
| Jordanians | 95.4 /100 | #117 | Exceptional 90.2% |
| Israelis | 95.1 /100 | #118 | Exceptional 90.1% |
| Immigrants | Eastern Europe | 94.9 /100 | #119 | Exceptional 90.1% |
| Ottawa | 94.4 /100 | #120 | Exceptional 90.1% |
| Whites/Caucasians | 94.1 /100 | #121 | Exceptional 90.1% |
Demographics Similar to Cheyenne by High School Diploma
In terms of high school diploma, the demographic groups most similar to Cheyenne are Immigrants from Uzbekistan (87.8%, a difference of 0.0%), Immigrants from Philippines (87.8%, a difference of 0.020%), Comanche (87.9%, a difference of 0.030%), Choctaw (87.8%, a difference of 0.030%), and Peruvian (87.8%, a difference of 0.040%).
| Demographics | Rating | Rank | High School Diploma |
| Immigrants | Bahamas | 2.9 /100 | #235 | Tragic 88.0% |
| Sub-Saharan Africans | 2.8 /100 | #236 | Tragic 87.9% |
| Taiwanese | 2.8 /100 | #237 | Tragic 87.9% |
| Sioux | 2.7 /100 | #238 | Tragic 87.9% |
| South Americans | 2.7 /100 | #239 | Tragic 87.9% |
| Comanche | 2.2 /100 | #240 | Tragic 87.9% |
| Immigrants | Uzbekistan | 2.1 /100 | #241 | Tragic 87.8% |
| Cheyenne | 2.1 /100 | #242 | Tragic 87.8% |
| Immigrants | Philippines | 1.9 /100 | #243 | Tragic 87.8% |
| Choctaw | 1.9 /100 | #244 | Tragic 87.8% |
| Peruvians | 1.9 /100 | #245 | Tragic 87.8% |
| Immigrants | Eritrea | 1.7 /100 | #246 | Tragic 87.8% |
| Immigrants | Costa Rica | 1.7 /100 | #247 | Tragic 87.8% |
| Spanish Americans | 1.5 /100 | #248 | Tragic 87.7% |
| Senegalese | 1.5 /100 | #249 | Tragic 87.7% |