Dominican vs Immigrants from Ecuador High School Diploma
COMPARE
Dominican
Immigrants from Ecuador
High School Diploma
High School Diploma Comparison
Dominicans
Immigrants from Ecuador
82.9%
HIGH SCHOOL DIPLOMA
0.0/ 100
METRIC RATING
328th/ 347
METRIC RANK
84.8%
HIGH SCHOOL DIPLOMA
0.0/ 100
METRIC RATING
313th/ 347
METRIC RANK
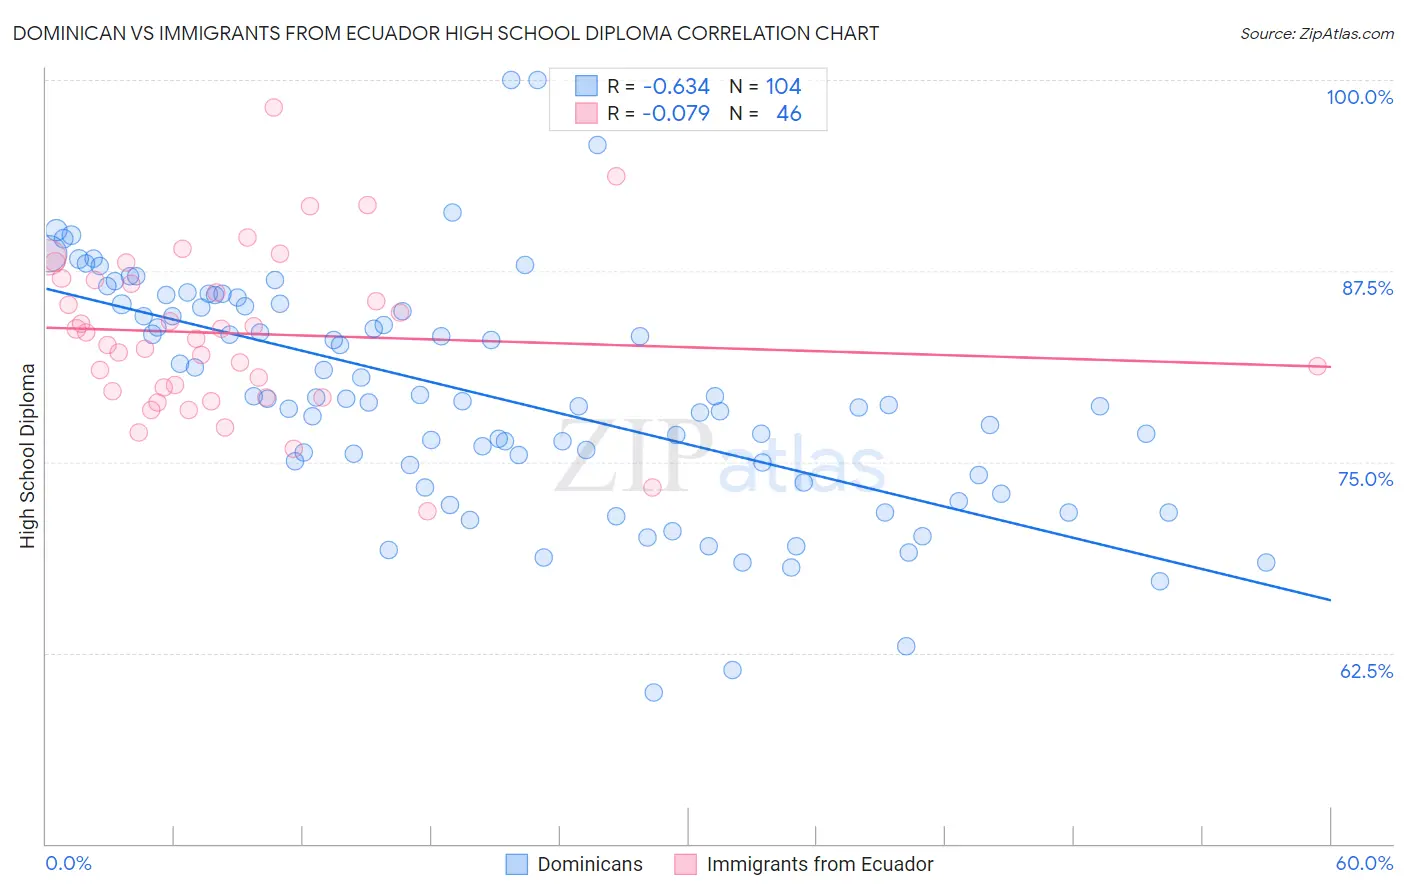
Dominican vs Immigrants from Ecuador High School Diploma Correlation Chart
The statistical analysis conducted on geographies consisting of 355,143,036 people shows a significant negative correlation between the proportion of Dominicans and percentage of population with at least high school diploma education in the United States with a correlation coefficient (R) of -0.634 and weighted average of 82.9%. Similarly, the statistical analysis conducted on geographies consisting of 270,907,929 people shows a slight negative correlation between the proportion of Immigrants from Ecuador and percentage of population with at least high school diploma education in the United States with a correlation coefficient (R) of -0.079 and weighted average of 84.8%, a difference of 2.3%.
High School Diploma Correlation Summary
| Measurement | Dominican | Immigrants from Ecuador |
| Minimum | 59.9% | 71.7% |
| Maximum | 100.0% | 98.2% |
| Range | 40.1% | 26.5% |
| Mean | 79.4% | 83.4% |
| Median | 79.0% | 83.3% |
| Interquartile 25% (IQ1) | 74.5% | 79.6% |
| Interquartile 75% (IQ3) | 85.3% | 86.9% |
| Interquartile Range (IQR) | 10.8% | 7.3% |
| Standard Deviation (Sample) | 7.6% | 5.3% |
| Standard Deviation (Population) | 7.6% | 5.2% |
Demographics Similar to Dominicans and Immigrants from Ecuador by High School Diploma
In terms of high school diploma, the demographic groups most similar to Dominicans are Honduran (83.0%, a difference of 0.050%), Mexican American Indian (83.0%, a difference of 0.090%), Hispanic or Latino (82.9%, a difference of 0.10%), Immigrants from Nicaragua (83.1%, a difference of 0.16%), and Immigrants from the Azores (82.8%, a difference of 0.17%). Similarly, the demographic groups most similar to Immigrants from Ecuador are Yaqui (84.7%, a difference of 0.11%), Puerto Rican (84.7%, a difference of 0.20%), Cape Verdean (85.1%, a difference of 0.26%), Ecuadorian (85.1%, a difference of 0.31%), and Apache (85.1%, a difference of 0.32%).
| Demographics | Rating | Rank | High School Diploma |
| Apache | 0.0 /100 | #310 | Tragic 85.1% |
| Ecuadorians | 0.0 /100 | #311 | Tragic 85.1% |
| Cape Verdeans | 0.0 /100 | #312 | Tragic 85.1% |
| Immigrants | Ecuador | 0.0 /100 | #313 | Tragic 84.8% |
| Yaqui | 0.0 /100 | #314 | Tragic 84.7% |
| Puerto Ricans | 0.0 /100 | #315 | Tragic 84.7% |
| Belizeans | 0.0 /100 | #316 | Tragic 84.3% |
| Immigrants | Caribbean | 0.0 /100 | #317 | Tragic 84.3% |
| Immigrants | Belize | 0.0 /100 | #318 | Tragic 84.2% |
| Central American Indians | 0.0 /100 | #319 | Tragic 84.2% |
| Nicaraguans | 0.0 /100 | #320 | Tragic 84.1% |
| Yuman | 0.0 /100 | #321 | Tragic 84.0% |
| Lumbee | 0.0 /100 | #322 | Tragic 83.6% |
| Immigrants | Cuba | 0.0 /100 | #323 | Tragic 83.5% |
| Immigrants | Cabo Verde | 0.0 /100 | #324 | Tragic 83.3% |
| Immigrants | Nicaragua | 0.0 /100 | #325 | Tragic 83.1% |
| Mexican American Indians | 0.0 /100 | #326 | Tragic 83.0% |
| Hondurans | 0.0 /100 | #327 | Tragic 83.0% |
| Dominicans | 0.0 /100 | #328 | Tragic 82.9% |
| Hispanics or Latinos | 0.0 /100 | #329 | Tragic 82.9% |
| Immigrants | Azores | 0.0 /100 | #330 | Tragic 82.8% |