Assyrian/Chaldean/Syriac vs Cheyenne High School Diploma
COMPARE
Assyrian/Chaldean/Syriac
Cheyenne
High School Diploma
High School Diploma Comparison
Assyrians/Chaldeans/Syriacs
Cheyenne
89.7%
HIGH SCHOOL DIPLOMA
82.5/ 100
METRIC RATING
138th/ 347
METRIC RANK
87.8%
HIGH SCHOOL DIPLOMA
2.1/ 100
METRIC RATING
242nd/ 347
METRIC RANK
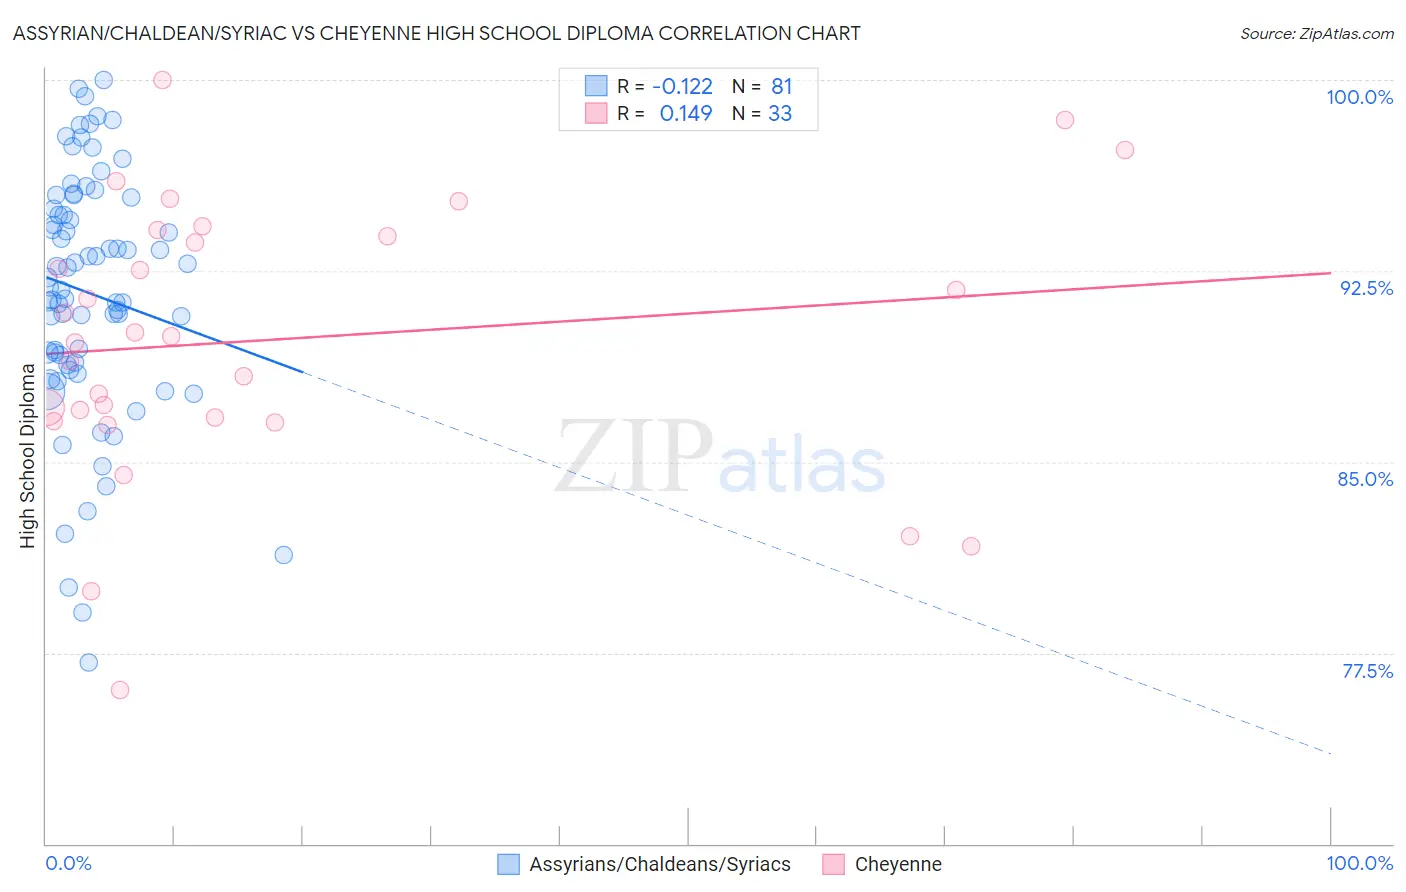
Assyrian/Chaldean/Syriac vs Cheyenne High School Diploma Correlation Chart
The statistical analysis conducted on geographies consisting of 110,318,304 people shows a poor negative correlation between the proportion of Assyrians/Chaldeans/Syriacs and percentage of population with at least high school diploma education in the United States with a correlation coefficient (R) of -0.122 and weighted average of 89.7%. Similarly, the statistical analysis conducted on geographies consisting of 80,719,287 people shows a poor positive correlation between the proportion of Cheyenne and percentage of population with at least high school diploma education in the United States with a correlation coefficient (R) of 0.149 and weighted average of 87.8%, a difference of 2.1%.
High School Diploma Correlation Summary
| Measurement | Assyrian/Chaldean/Syriac | Cheyenne |
| Minimum | 77.1% | 76.1% |
| Maximum | 100.0% | 100.0% |
| Range | 22.9% | 23.9% |
| Mean | 91.6% | 89.8% |
| Median | 91.9% | 90.0% |
| Interquartile 25% (IQ1) | 88.8% | 86.7% |
| Interquartile 75% (IQ3) | 95.2% | 94.0% |
| Interquartile Range (IQR) | 6.3% | 7.3% |
| Standard Deviation (Sample) | 4.9% | 5.4% |
| Standard Deviation (Population) | 4.8% | 5.3% |
Similar Demographics by High School Diploma
Demographics Similar to Assyrians/Chaldeans/Syriacs by High School Diploma
In terms of high school diploma, the demographic groups most similar to Assyrians/Chaldeans/Syriacs are Ugandan (89.7%, a difference of 0.030%), Arab (89.7%, a difference of 0.030%), Kenyan (89.6%, a difference of 0.030%), Immigrants from Egypt (89.6%, a difference of 0.030%), and Chilean (89.6%, a difference of 0.080%).
| Demographics | Rating | Rank | High School Diploma |
| Immigrants | Italy | 87.4 /100 | #131 | Excellent 89.8% |
| Immigrants | Bosnia and Herzegovina | 87.3 /100 | #132 | Excellent 89.8% |
| Albanians | 87.2 /100 | #133 | Excellent 89.8% |
| Immigrants | Jordan | 87.2 /100 | #134 | Excellent 89.8% |
| Chippewa | 85.6 /100 | #135 | Excellent 89.7% |
| Ugandans | 83.7 /100 | #136 | Excellent 89.7% |
| Arabs | 83.6 /100 | #137 | Excellent 89.7% |
| Assyrians/Chaldeans/Syriacs | 82.5 /100 | #138 | Excellent 89.7% |
| Kenyans | 81.4 /100 | #139 | Excellent 89.6% |
| Immigrants | Egypt | 81.2 /100 | #140 | Excellent 89.6% |
| Chileans | 79.0 /100 | #141 | Good 89.6% |
| Indians (Asian) | 78.8 /100 | #142 | Good 89.6% |
| Pakistanis | 78.3 /100 | #143 | Good 89.6% |
| Immigrants | Kenya | 78.0 /100 | #144 | Good 89.6% |
| Immigrants | Brazil | 76.6 /100 | #145 | Good 89.5% |
Demographics Similar to Cheyenne by High School Diploma
In terms of high school diploma, the demographic groups most similar to Cheyenne are Immigrants from Uzbekistan (87.8%, a difference of 0.0%), Immigrants from Philippines (87.8%, a difference of 0.020%), Comanche (87.9%, a difference of 0.030%), Choctaw (87.8%, a difference of 0.030%), and Peruvian (87.8%, a difference of 0.040%).
| Demographics | Rating | Rank | High School Diploma |
| Immigrants | Bahamas | 2.9 /100 | #235 | Tragic 88.0% |
| Sub-Saharan Africans | 2.8 /100 | #236 | Tragic 87.9% |
| Taiwanese | 2.8 /100 | #237 | Tragic 87.9% |
| Sioux | 2.7 /100 | #238 | Tragic 87.9% |
| South Americans | 2.7 /100 | #239 | Tragic 87.9% |
| Comanche | 2.2 /100 | #240 | Tragic 87.9% |
| Immigrants | Uzbekistan | 2.1 /100 | #241 | Tragic 87.8% |
| Cheyenne | 2.1 /100 | #242 | Tragic 87.8% |
| Immigrants | Philippines | 1.9 /100 | #243 | Tragic 87.8% |
| Choctaw | 1.9 /100 | #244 | Tragic 87.8% |
| Peruvians | 1.9 /100 | #245 | Tragic 87.8% |
| Immigrants | Eritrea | 1.7 /100 | #246 | Tragic 87.8% |
| Immigrants | Costa Rica | 1.7 /100 | #247 | Tragic 87.8% |
| Spanish Americans | 1.5 /100 | #248 | Tragic 87.7% |
| Senegalese | 1.5 /100 | #249 | Tragic 87.7% |