Crow vs Latvian Master's Degree
COMPARE
Crow
Latvian
Master's Degree
Master's Degree Comparison
Crow
Latvians
10.6%
MASTER'S DEGREE
0.0/ 100
METRIC RATING
323rd/ 347
METRIC RANK
19.8%
MASTER'S DEGREE
100.0/ 100
METRIC RATING
29th/ 347
METRIC RANK
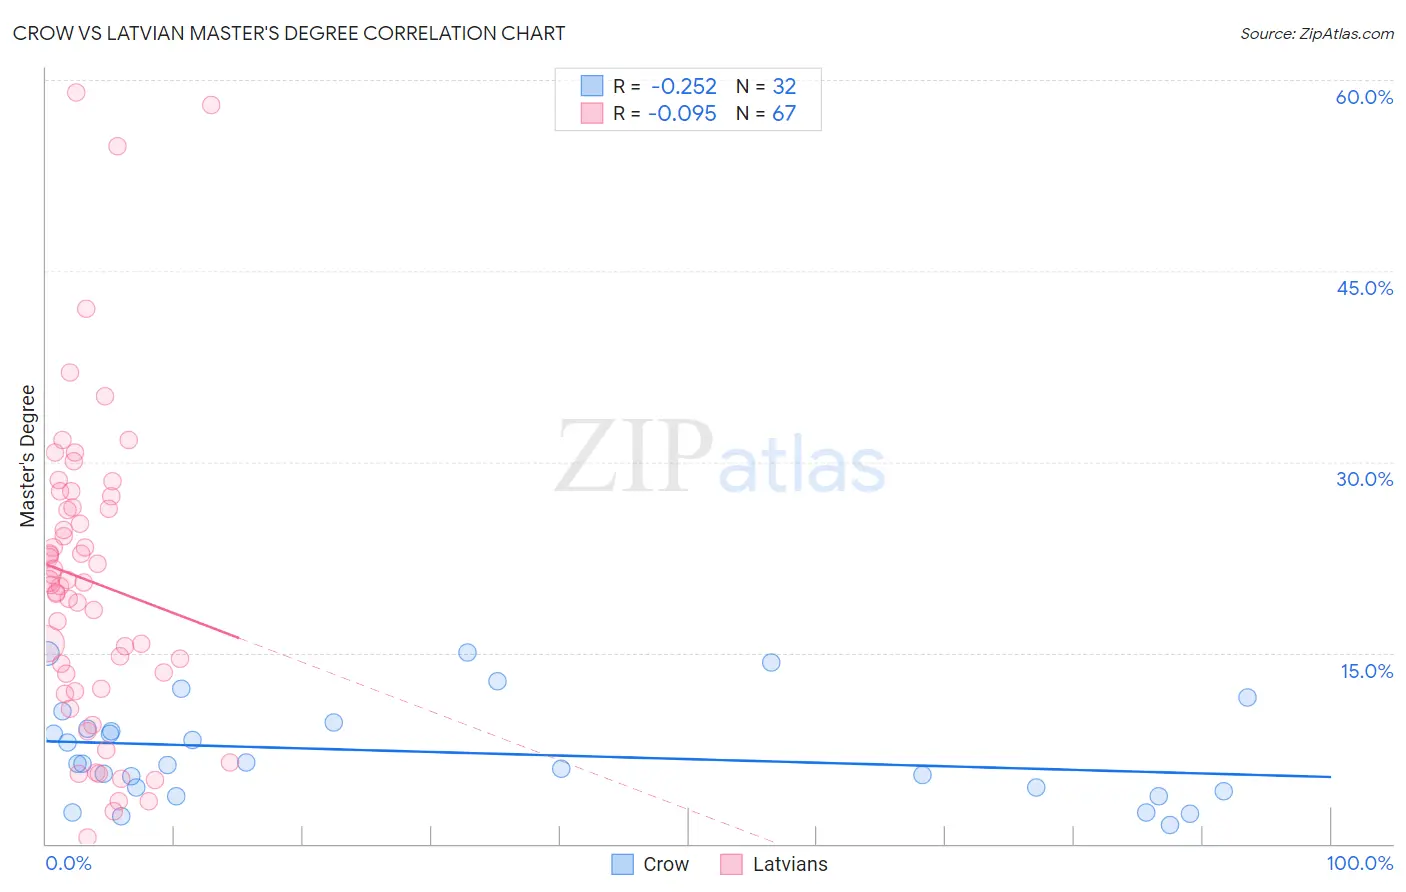
Crow vs Latvian Master's Degree Correlation Chart
The statistical analysis conducted on geographies consisting of 59,200,277 people shows a weak negative correlation between the proportion of Crow and percentage of population with at least master's degree education in the United States with a correlation coefficient (R) of -0.252 and weighted average of 10.6%. Similarly, the statistical analysis conducted on geographies consisting of 220,706,916 people shows a slight negative correlation between the proportion of Latvians and percentage of population with at least master's degree education in the United States with a correlation coefficient (R) of -0.095 and weighted average of 19.8%, a difference of 86.4%.
Master's Degree Correlation Summary
| Measurement | Crow | Latvian |
| Minimum | 1.4% | 0.45% |
| Maximum | 15.0% | 59.0% |
| Range | 13.6% | 58.6% |
| Mean | 7.2% | 20.7% |
| Median | 6.2% | 20.5% |
| Interquartile 25% (IQ1) | 4.3% | 12.2% |
| Interquartile 75% (IQ3) | 9.3% | 26.5% |
| Interquartile Range (IQR) | 5.0% | 14.3% |
| Standard Deviation (Sample) | 3.9% | 12.2% |
| Standard Deviation (Population) | 3.8% | 12.1% |
Similar Demographics by Master's Degree
Demographics Similar to Crow by Master's Degree
In terms of master's degree, the demographic groups most similar to Crow are Dutch West Indian (10.6%, a difference of 0.040%), Sioux (10.7%, a difference of 0.39%), Pennsylvania German (10.7%, a difference of 1.0%), Inupiat (10.5%, a difference of 1.1%), and Creek (10.5%, a difference of 1.1%).
| Demographics | Rating | Rank | Master's Degree |
| Hispanics or Latinos | 0.0 /100 | #316 | Tragic 10.9% |
| Hopi | 0.0 /100 | #317 | Tragic 10.9% |
| Immigrants | Cuba | 0.0 /100 | #318 | Tragic 10.9% |
| Kiowa | 0.0 /100 | #319 | Tragic 10.8% |
| Immigrants | Micronesia | 0.0 /100 | #320 | Tragic 10.8% |
| Pennsylvania Germans | 0.0 /100 | #321 | Tragic 10.7% |
| Sioux | 0.0 /100 | #322 | Tragic 10.7% |
| Crow | 0.0 /100 | #323 | Tragic 10.6% |
| Dutch West Indians | 0.0 /100 | #324 | Tragic 10.6% |
| Inupiat | 0.0 /100 | #325 | Tragic 10.5% |
| Creek | 0.0 /100 | #326 | Tragic 10.5% |
| Paiute | 0.0 /100 | #327 | Tragic 10.5% |
| Bangladeshis | 0.0 /100 | #328 | Tragic 10.5% |
| Nepalese | 0.0 /100 | #329 | Tragic 10.5% |
| Fijians | 0.0 /100 | #330 | Tragic 10.3% |
Demographics Similar to Latvians by Master's Degree
In terms of master's degree, the demographic groups most similar to Latvians are Turkish (19.9%, a difference of 0.41%), Immigrants from Sri Lanka (19.9%, a difference of 0.48%), Immigrants from Turkey (19.7%, a difference of 0.50%), Immigrants from Korea (19.7%, a difference of 0.52%), and Burmese (19.7%, a difference of 0.58%).
| Demographics | Rating | Rank | Master's Degree |
| Israelis | 100.0 /100 | #22 | Exceptional 20.3% |
| Immigrants | France | 100.0 /100 | #23 | Exceptional 20.3% |
| Immigrants | Sweden | 100.0 /100 | #24 | Exceptional 20.3% |
| Immigrants | Japan | 100.0 /100 | #25 | Exceptional 20.0% |
| Cambodians | 100.0 /100 | #26 | Exceptional 20.0% |
| Immigrants | Sri Lanka | 100.0 /100 | #27 | Exceptional 19.9% |
| Turks | 100.0 /100 | #28 | Exceptional 19.9% |
| Latvians | 100.0 /100 | #29 | Exceptional 19.8% |
| Immigrants | Turkey | 100.0 /100 | #30 | Exceptional 19.7% |
| Immigrants | Korea | 100.0 /100 | #31 | Exceptional 19.7% |
| Burmese | 100.0 /100 | #32 | Exceptional 19.7% |
| Russians | 100.0 /100 | #33 | Exceptional 19.5% |
| Immigrants | Denmark | 100.0 /100 | #34 | Exceptional 19.5% |
| Immigrants | Northern Europe | 100.0 /100 | #35 | Exceptional 19.5% |
| Immigrants | Russia | 100.0 /100 | #36 | Exceptional 19.4% |