American vs Latvian Master's Degree
COMPARE
American
Latvian
Master's Degree
Master's Degree Comparison
Americans
Latvians
12.3%
MASTER'S DEGREE
0.4/ 100
METRIC RATING
267th/ 347
METRIC RANK
19.8%
MASTER'S DEGREE
100.0/ 100
METRIC RATING
29th/ 347
METRIC RANK
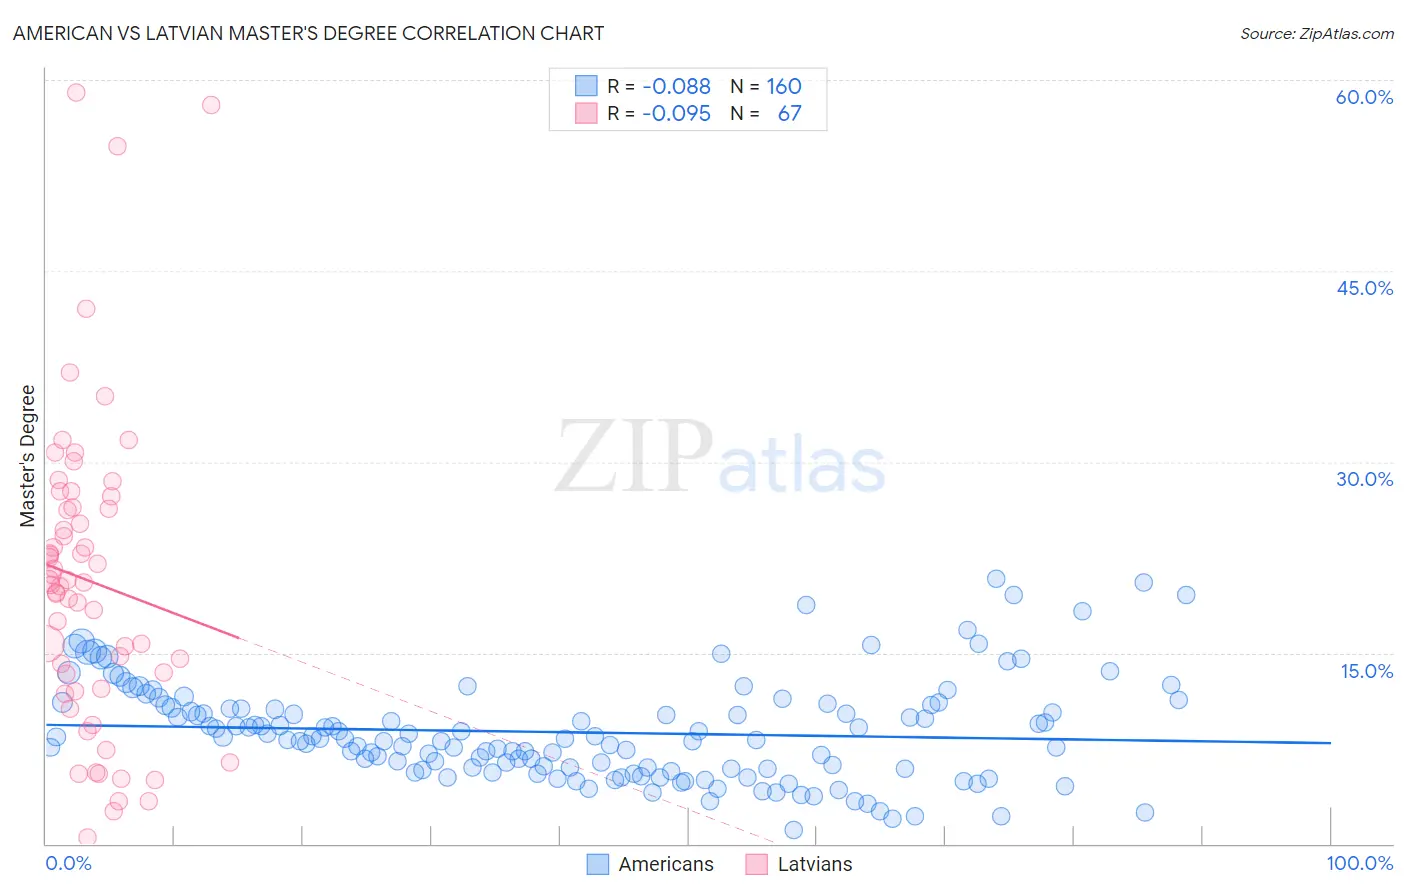
American vs Latvian Master's Degree Correlation Chart
The statistical analysis conducted on geographies consisting of 580,510,045 people shows a slight negative correlation between the proportion of Americans and percentage of population with at least master's degree education in the United States with a correlation coefficient (R) of -0.088 and weighted average of 12.3%. Similarly, the statistical analysis conducted on geographies consisting of 220,706,916 people shows a slight negative correlation between the proportion of Latvians and percentage of population with at least master's degree education in the United States with a correlation coefficient (R) of -0.095 and weighted average of 19.8%, a difference of 61.1%.
Master's Degree Correlation Summary
| Measurement | American | Latvian |
| Minimum | 1.1% | 0.45% |
| Maximum | 20.8% | 59.0% |
| Range | 19.8% | 58.6% |
| Mean | 8.8% | 20.7% |
| Median | 8.3% | 20.5% |
| Interquartile 25% (IQ1) | 5.9% | 12.2% |
| Interquartile 75% (IQ3) | 10.8% | 26.5% |
| Interquartile Range (IQR) | 4.9% | 14.3% |
| Standard Deviation (Sample) | 3.9% | 12.2% |
| Standard Deviation (Population) | 3.9% | 12.1% |
Similar Demographics by Master's Degree
Demographics Similar to Americans by Master's Degree
In terms of master's degree, the demographic groups most similar to Americans are Native Hawaiian (12.3%, a difference of 0.25%), Bahamian (12.4%, a difference of 0.76%), Central American (12.2%, a difference of 0.90%), Immigrants from Fiji (12.4%, a difference of 0.91%), and Belizean (12.4%, a difference of 0.93%).
| Demographics | Rating | Rank | Master's Degree |
| Dominicans | 0.6 /100 | #260 | Tragic 12.5% |
| Tongans | 0.6 /100 | #261 | Tragic 12.5% |
| Nicaraguans | 0.6 /100 | #262 | Tragic 12.5% |
| Central American Indians | 0.5 /100 | #263 | Tragic 12.4% |
| Belizeans | 0.5 /100 | #264 | Tragic 12.4% |
| Immigrants | Fiji | 0.5 /100 | #265 | Tragic 12.4% |
| Bahamians | 0.5 /100 | #266 | Tragic 12.4% |
| Americans | 0.4 /100 | #267 | Tragic 12.3% |
| Native Hawaiians | 0.4 /100 | #268 | Tragic 12.3% |
| Central Americans | 0.3 /100 | #269 | Tragic 12.2% |
| Salvadorans | 0.3 /100 | #270 | Tragic 12.2% |
| Haitians | 0.3 /100 | #271 | Tragic 12.1% |
| Comanche | 0.3 /100 | #272 | Tragic 12.1% |
| Blackfeet | 0.3 /100 | #273 | Tragic 12.1% |
| Cape Verdeans | 0.3 /100 | #274 | Tragic 12.1% |
Demographics Similar to Latvians by Master's Degree
In terms of master's degree, the demographic groups most similar to Latvians are Turkish (19.9%, a difference of 0.41%), Immigrants from Sri Lanka (19.9%, a difference of 0.48%), Immigrants from Turkey (19.7%, a difference of 0.50%), Immigrants from Korea (19.7%, a difference of 0.52%), and Burmese (19.7%, a difference of 0.58%).
| Demographics | Rating | Rank | Master's Degree |
| Israelis | 100.0 /100 | #22 | Exceptional 20.3% |
| Immigrants | France | 100.0 /100 | #23 | Exceptional 20.3% |
| Immigrants | Sweden | 100.0 /100 | #24 | Exceptional 20.3% |
| Immigrants | Japan | 100.0 /100 | #25 | Exceptional 20.0% |
| Cambodians | 100.0 /100 | #26 | Exceptional 20.0% |
| Immigrants | Sri Lanka | 100.0 /100 | #27 | Exceptional 19.9% |
| Turks | 100.0 /100 | #28 | Exceptional 19.9% |
| Latvians | 100.0 /100 | #29 | Exceptional 19.8% |
| Immigrants | Turkey | 100.0 /100 | #30 | Exceptional 19.7% |
| Immigrants | Korea | 100.0 /100 | #31 | Exceptional 19.7% |
| Burmese | 100.0 /100 | #32 | Exceptional 19.7% |
| Russians | 100.0 /100 | #33 | Exceptional 19.5% |
| Immigrants | Denmark | 100.0 /100 | #34 | Exceptional 19.5% |
| Immigrants | Northern Europe | 100.0 /100 | #35 | Exceptional 19.5% |
| Immigrants | Russia | 100.0 /100 | #36 | Exceptional 19.4% |