Crow vs Estonian Master's Degree
COMPARE
Crow
Estonian
Master's Degree
Master's Degree Comparison
Crow
Estonians
10.6%
MASTER'S DEGREE
0.0/ 100
METRIC RATING
323rd/ 347
METRIC RANK
18.8%
MASTER'S DEGREE
100.0/ 100
METRIC RATING
49th/ 347
METRIC RANK
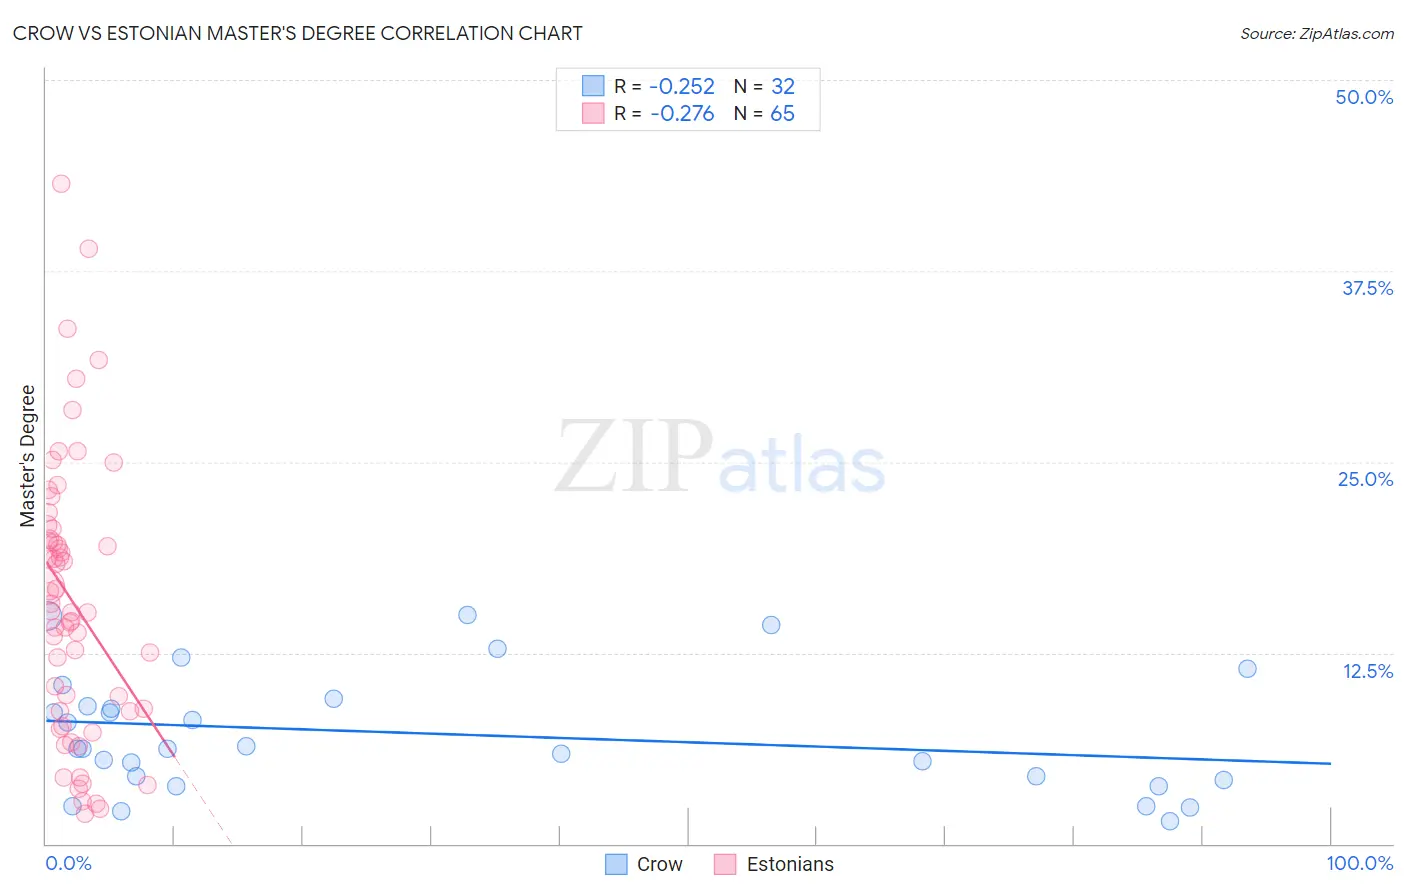
Crow vs Estonian Master's Degree Correlation Chart
The statistical analysis conducted on geographies consisting of 59,200,277 people shows a weak negative correlation between the proportion of Crow and percentage of population with at least master's degree education in the United States with a correlation coefficient (R) of -0.252 and weighted average of 10.6%. Similarly, the statistical analysis conducted on geographies consisting of 123,509,943 people shows a weak negative correlation between the proportion of Estonians and percentage of population with at least master's degree education in the United States with a correlation coefficient (R) of -0.276 and weighted average of 18.8%, a difference of 76.7%.
Master's Degree Correlation Summary
| Measurement | Crow | Estonian |
| Minimum | 1.4% | 2.0% |
| Maximum | 15.0% | 43.2% |
| Range | 13.6% | 41.2% |
| Mean | 7.2% | 15.9% |
| Median | 6.2% | 15.2% |
| Interquartile 25% (IQ1) | 4.3% | 8.7% |
| Interquartile 75% (IQ3) | 9.3% | 20.3% |
| Interquartile Range (IQR) | 5.0% | 11.6% |
| Standard Deviation (Sample) | 3.9% | 9.0% |
| Standard Deviation (Population) | 3.8% | 8.9% |
Similar Demographics by Master's Degree
Demographics Similar to Crow by Master's Degree
In terms of master's degree, the demographic groups most similar to Crow are Dutch West Indian (10.6%, a difference of 0.040%), Sioux (10.7%, a difference of 0.39%), Pennsylvania German (10.7%, a difference of 1.0%), Inupiat (10.5%, a difference of 1.1%), and Creek (10.5%, a difference of 1.1%).
| Demographics | Rating | Rank | Master's Degree |
| Hispanics or Latinos | 0.0 /100 | #316 | Tragic 10.9% |
| Hopi | 0.0 /100 | #317 | Tragic 10.9% |
| Immigrants | Cuba | 0.0 /100 | #318 | Tragic 10.9% |
| Kiowa | 0.0 /100 | #319 | Tragic 10.8% |
| Immigrants | Micronesia | 0.0 /100 | #320 | Tragic 10.8% |
| Pennsylvania Germans | 0.0 /100 | #321 | Tragic 10.7% |
| Sioux | 0.0 /100 | #322 | Tragic 10.7% |
| Crow | 0.0 /100 | #323 | Tragic 10.6% |
| Dutch West Indians | 0.0 /100 | #324 | Tragic 10.6% |
| Inupiat | 0.0 /100 | #325 | Tragic 10.5% |
| Creek | 0.0 /100 | #326 | Tragic 10.5% |
| Paiute | 0.0 /100 | #327 | Tragic 10.5% |
| Bangladeshis | 0.0 /100 | #328 | Tragic 10.5% |
| Nepalese | 0.0 /100 | #329 | Tragic 10.5% |
| Fijians | 0.0 /100 | #330 | Tragic 10.3% |
Demographics Similar to Estonians by Master's Degree
In terms of master's degree, the demographic groups most similar to Estonians are Paraguayan (18.8%, a difference of 0.10%), Immigrants from Austria (18.8%, a difference of 0.16%), Immigrants from Norway (18.8%, a difference of 0.17%), Bulgarian (18.8%, a difference of 0.19%), and Immigrants from South Africa (18.8%, a difference of 0.20%).
| Demographics | Rating | Rank | Master's Degree |
| Immigrants | Saudi Arabia | 100.0 /100 | #42 | Exceptional 19.0% |
| Immigrants | Greece | 100.0 /100 | #43 | Exceptional 19.0% |
| Immigrants | Malaysia | 100.0 /100 | #44 | Exceptional 18.9% |
| Immigrants | Belarus | 100.0 /100 | #45 | Exceptional 18.9% |
| Immigrants | Norway | 100.0 /100 | #46 | Exceptional 18.8% |
| Immigrants | Austria | 100.0 /100 | #47 | Exceptional 18.8% |
| Paraguayans | 100.0 /100 | #48 | Exceptional 18.8% |
| Estonians | 100.0 /100 | #49 | Exceptional 18.8% |
| Bulgarians | 100.0 /100 | #50 | Exceptional 18.8% |
| Immigrants | South Africa | 100.0 /100 | #51 | Exceptional 18.8% |
| Immigrants | Kuwait | 100.0 /100 | #52 | Exceptional 18.6% |
| Immigrants | Czechoslovakia | 99.9 /100 | #53 | Exceptional 18.5% |
| Immigrants | Lithuania | 99.9 /100 | #54 | Exceptional 18.5% |
| Immigrants | Serbia | 99.9 /100 | #55 | Exceptional 18.5% |
| Asians | 99.9 /100 | #56 | Exceptional 18.4% |