Immigrants from Taiwan vs Latvian Master's Degree
COMPARE
Immigrants from Taiwan
Latvian
Master's Degree
Master's Degree Comparison
Immigrants from Taiwan
Latvians
22.5%
MASTER'S DEGREE
100.0/ 100
METRIC RATING
5th/ 347
METRIC RANK
19.8%
MASTER'S DEGREE
100.0/ 100
METRIC RATING
29th/ 347
METRIC RANK
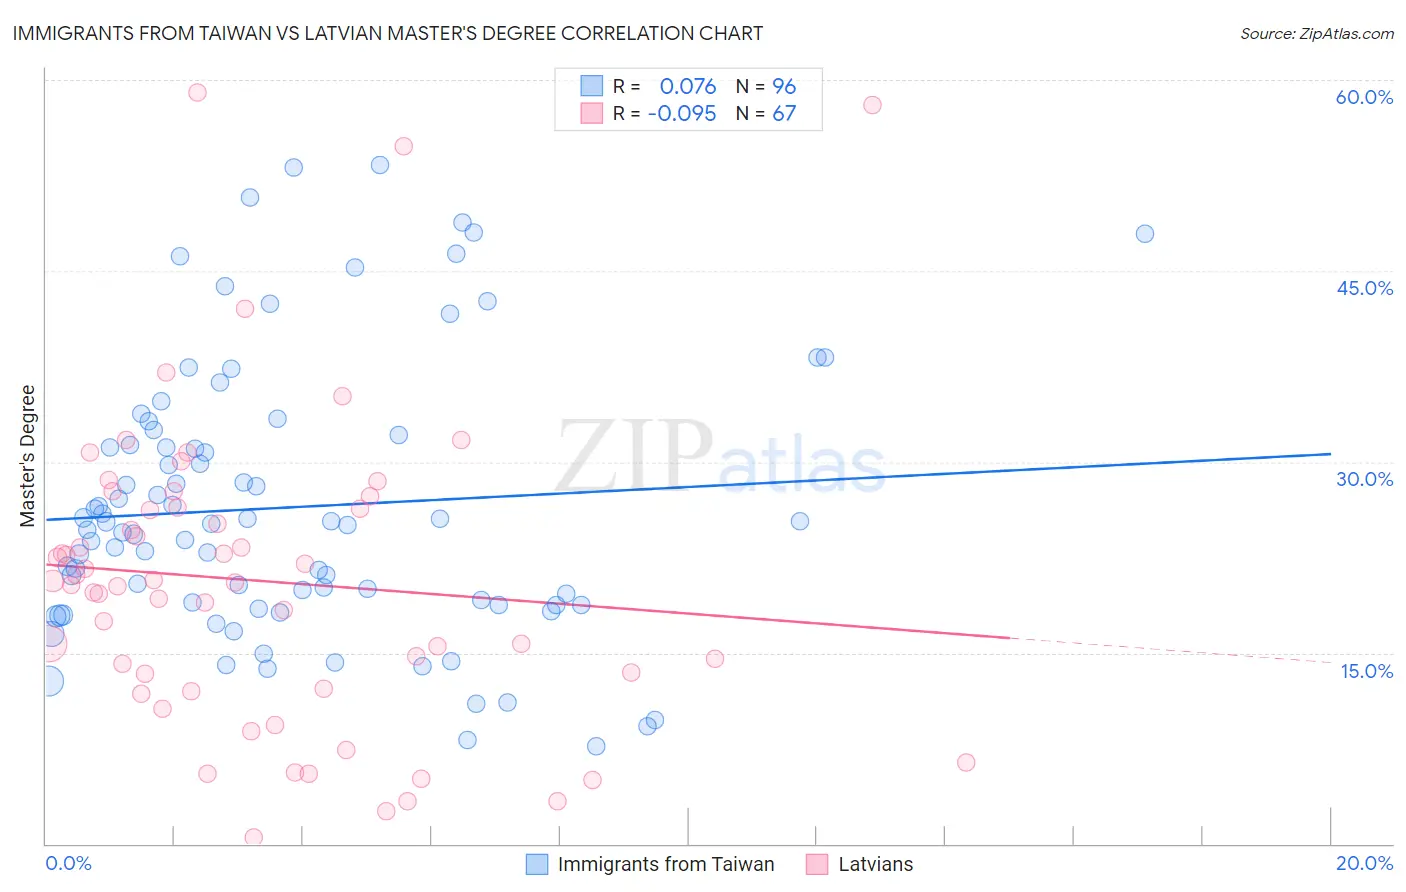
Immigrants from Taiwan vs Latvian Master's Degree Correlation Chart
The statistical analysis conducted on geographies consisting of 298,228,086 people shows a slight positive correlation between the proportion of Immigrants from Taiwan and percentage of population with at least master's degree education in the United States with a correlation coefficient (R) of 0.076 and weighted average of 22.5%. Similarly, the statistical analysis conducted on geographies consisting of 220,706,916 people shows a slight negative correlation between the proportion of Latvians and percentage of population with at least master's degree education in the United States with a correlation coefficient (R) of -0.095 and weighted average of 19.8%, a difference of 13.4%.
Master's Degree Correlation Summary
| Measurement | Immigrants from Taiwan | Latvian |
| Minimum | 7.7% | 0.45% |
| Maximum | 53.3% | 59.0% |
| Range | 45.6% | 58.6% |
| Mean | 26.4% | 20.7% |
| Median | 25.1% | 20.5% |
| Interquartile 25% (IQ1) | 18.8% | 12.2% |
| Interquartile 75% (IQ3) | 31.7% | 26.5% |
| Interquartile Range (IQR) | 13.0% | 14.3% |
| Standard Deviation (Sample) | 10.7% | 12.2% |
| Standard Deviation (Population) | 10.7% | 12.1% |
Similar Demographics by Master's Degree
Demographics Similar to Immigrants from Taiwan by Master's Degree
In terms of master's degree, the demographic groups most similar to Immigrants from Taiwan are Immigrants from India (22.3%, a difference of 0.68%), Immigrants from Israel (22.6%, a difference of 0.80%), Okinawan (22.6%, a difference of 0.80%), Iranian (22.3%, a difference of 0.88%), and Cypriot (21.8%, a difference of 3.1%).
| Demographics | Rating | Rank | Master's Degree |
| Immigrants | Singapore | 100.0 /100 | #1 | Exceptional 23.4% |
| Filipinos | 100.0 /100 | #2 | Exceptional 23.4% |
| Immigrants | Israel | 100.0 /100 | #3 | Exceptional 22.6% |
| Okinawans | 100.0 /100 | #4 | Exceptional 22.6% |
| Immigrants | Taiwan | 100.0 /100 | #5 | Exceptional 22.5% |
| Immigrants | India | 100.0 /100 | #6 | Exceptional 22.3% |
| Iranians | 100.0 /100 | #7 | Exceptional 22.3% |
| Cypriots | 100.0 /100 | #8 | Exceptional 21.8% |
| Thais | 100.0 /100 | #9 | Exceptional 21.7% |
| Immigrants | Iran | 100.0 /100 | #10 | Exceptional 21.6% |
| Immigrants | China | 100.0 /100 | #11 | Exceptional 21.2% |
| Eastern Europeans | 100.0 /100 | #12 | Exceptional 21.1% |
| Immigrants | Australia | 100.0 /100 | #13 | Exceptional 20.9% |
| Immigrants | Switzerland | 100.0 /100 | #14 | Exceptional 20.9% |
| Immigrants | Eastern Asia | 100.0 /100 | #15 | Exceptional 20.8% |
Demographics Similar to Latvians by Master's Degree
In terms of master's degree, the demographic groups most similar to Latvians are Turkish (19.9%, a difference of 0.41%), Immigrants from Sri Lanka (19.9%, a difference of 0.48%), Immigrants from Turkey (19.7%, a difference of 0.50%), Immigrants from Korea (19.7%, a difference of 0.52%), and Burmese (19.7%, a difference of 0.58%).
| Demographics | Rating | Rank | Master's Degree |
| Israelis | 100.0 /100 | #22 | Exceptional 20.3% |
| Immigrants | France | 100.0 /100 | #23 | Exceptional 20.3% |
| Immigrants | Sweden | 100.0 /100 | #24 | Exceptional 20.3% |
| Immigrants | Japan | 100.0 /100 | #25 | Exceptional 20.0% |
| Cambodians | 100.0 /100 | #26 | Exceptional 20.0% |
| Immigrants | Sri Lanka | 100.0 /100 | #27 | Exceptional 19.9% |
| Turks | 100.0 /100 | #28 | Exceptional 19.9% |
| Latvians | 100.0 /100 | #29 | Exceptional 19.8% |
| Immigrants | Turkey | 100.0 /100 | #30 | Exceptional 19.7% |
| Immigrants | Korea | 100.0 /100 | #31 | Exceptional 19.7% |
| Burmese | 100.0 /100 | #32 | Exceptional 19.7% |
| Russians | 100.0 /100 | #33 | Exceptional 19.5% |
| Immigrants | Denmark | 100.0 /100 | #34 | Exceptional 19.5% |
| Immigrants | Northern Europe | 100.0 /100 | #35 | Exceptional 19.5% |
| Immigrants | Russia | 100.0 /100 | #36 | Exceptional 19.4% |