Maltese vs Latvian Master's Degree
COMPARE
Maltese
Latvian
Master's Degree
Master's Degree Comparison
Maltese
Latvians
17.3%
MASTER'S DEGREE
99.3/ 100
METRIC RATING
87th/ 347
METRIC RANK
19.8%
MASTER'S DEGREE
100.0/ 100
METRIC RATING
29th/ 347
METRIC RANK
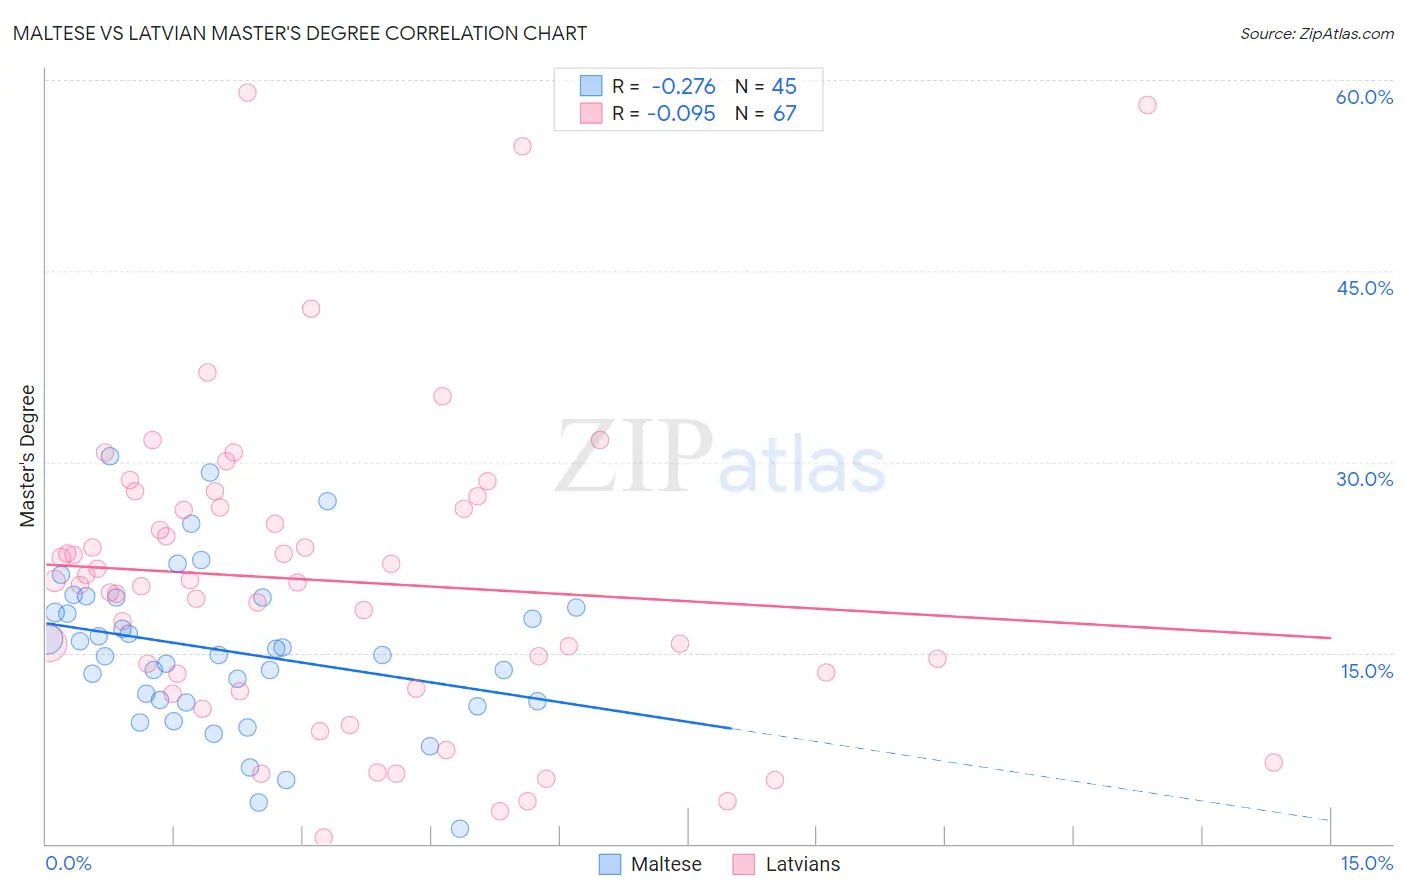
Maltese vs Latvian Master's Degree Correlation Chart
The statistical analysis conducted on geographies consisting of 126,460,442 people shows a weak negative correlation between the proportion of Maltese and percentage of population with at least master's degree education in the United States with a correlation coefficient (R) of -0.276 and weighted average of 17.3%. Similarly, the statistical analysis conducted on geographies consisting of 220,706,916 people shows a slight negative correlation between the proportion of Latvians and percentage of population with at least master's degree education in the United States with a correlation coefficient (R) of -0.095 and weighted average of 19.8%, a difference of 14.8%.
Master's Degree Correlation Summary
| Measurement | Maltese | Latvian |
| Minimum | 1.2% | 0.45% |
| Maximum | 30.4% | 59.0% |
| Range | 29.2% | 58.6% |
| Mean | 15.1% | 20.7% |
| Median | 14.8% | 20.5% |
| Interquartile 25% (IQ1) | 11.1% | 12.2% |
| Interquartile 75% (IQ3) | 18.9% | 26.5% |
| Interquartile Range (IQR) | 7.8% | 14.3% |
| Standard Deviation (Sample) | 6.3% | 12.2% |
| Standard Deviation (Population) | 6.2% | 12.1% |
Similar Demographics by Master's Degree
Demographics Similar to Maltese by Master's Degree
In terms of master's degree, the demographic groups most similar to Maltese are Immigrants from Croatia (17.3%, a difference of 0.10%), Immigrants from Canada (17.2%, a difference of 0.36%), Bhutanese (17.2%, a difference of 0.43%), Immigrants from Egypt (17.2%, a difference of 0.45%), and Immigrants from Brazil (17.4%, a difference of 0.51%).
| Demographics | Rating | Rank | Master's Degree |
| Carpatho Rusyns | 99.6 /100 | #80 | Exceptional 17.5% |
| Immigrants | Western Asia | 99.5 /100 | #81 | Exceptional 17.5% |
| Greeks | 99.5 /100 | #82 | Exceptional 17.5% |
| Immigrants | Zimbabwe | 99.5 /100 | #83 | Exceptional 17.4% |
| Immigrants | Scotland | 99.4 /100 | #84 | Exceptional 17.4% |
| Immigrants | Brazil | 99.4 /100 | #85 | Exceptional 17.4% |
| Immigrants | Croatia | 99.3 /100 | #86 | Exceptional 17.3% |
| Maltese | 99.3 /100 | #87 | Exceptional 17.3% |
| Immigrants | Canada | 99.2 /100 | #88 | Exceptional 17.2% |
| Bhutanese | 99.1 /100 | #89 | Exceptional 17.2% |
| Immigrants | Egypt | 99.1 /100 | #90 | Exceptional 17.2% |
| Romanians | 99.1 /100 | #91 | Exceptional 17.2% |
| Immigrants | North America | 99.1 /100 | #92 | Exceptional 17.2% |
| Immigrants | Italy | 99.1 /100 | #93 | Exceptional 17.2% |
| Ugandans | 99.0 /100 | #94 | Exceptional 17.1% |
Demographics Similar to Latvians by Master's Degree
In terms of master's degree, the demographic groups most similar to Latvians are Turkish (19.9%, a difference of 0.41%), Immigrants from Sri Lanka (19.9%, a difference of 0.48%), Immigrants from Turkey (19.7%, a difference of 0.50%), Immigrants from Korea (19.7%, a difference of 0.52%), and Burmese (19.7%, a difference of 0.58%).
| Demographics | Rating | Rank | Master's Degree |
| Israelis | 100.0 /100 | #22 | Exceptional 20.3% |
| Immigrants | France | 100.0 /100 | #23 | Exceptional 20.3% |
| Immigrants | Sweden | 100.0 /100 | #24 | Exceptional 20.3% |
| Immigrants | Japan | 100.0 /100 | #25 | Exceptional 20.0% |
| Cambodians | 100.0 /100 | #26 | Exceptional 20.0% |
| Immigrants | Sri Lanka | 100.0 /100 | #27 | Exceptional 19.9% |
| Turks | 100.0 /100 | #28 | Exceptional 19.9% |
| Latvians | 100.0 /100 | #29 | Exceptional 19.8% |
| Immigrants | Turkey | 100.0 /100 | #30 | Exceptional 19.7% |
| Immigrants | Korea | 100.0 /100 | #31 | Exceptional 19.7% |
| Burmese | 100.0 /100 | #32 | Exceptional 19.7% |
| Russians | 100.0 /100 | #33 | Exceptional 19.5% |
| Immigrants | Denmark | 100.0 /100 | #34 | Exceptional 19.5% |
| Immigrants | Northern Europe | 100.0 /100 | #35 | Exceptional 19.5% |
| Immigrants | Russia | 100.0 /100 | #36 | Exceptional 19.4% |