Crow vs Immigrants from Honduras Master's Degree
COMPARE
Crow
Immigrants from Honduras
Master's Degree
Master's Degree Comparison
Crow
Immigrants from Honduras
10.6%
MASTER'S DEGREE
0.0/ 100
METRIC RATING
323rd/ 347
METRIC RANK
11.8%
MASTER'S DEGREE
0.1/ 100
METRIC RATING
288th/ 347
METRIC RANK
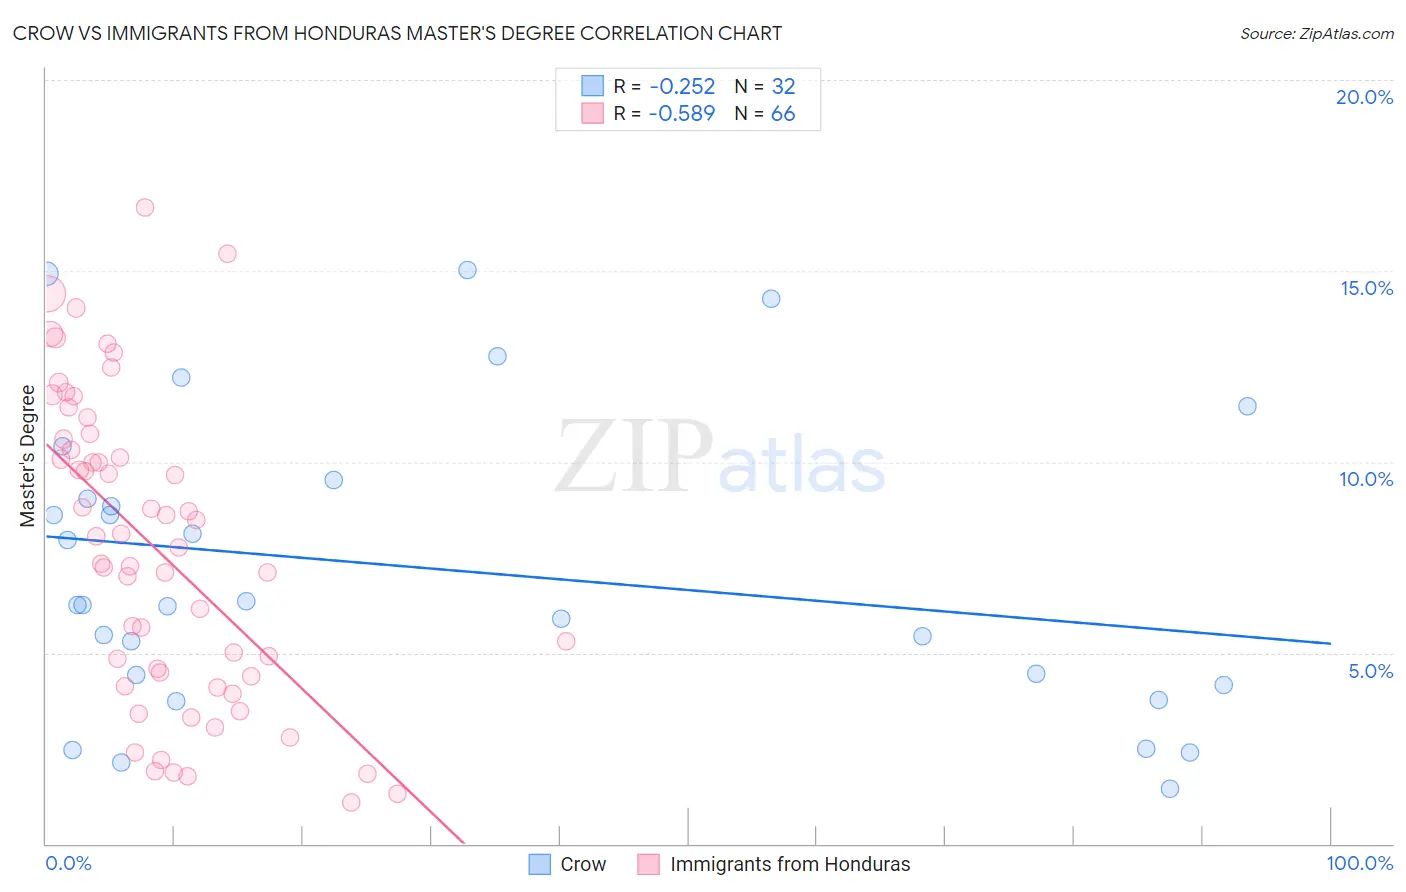
Crow vs Immigrants from Honduras Master's Degree Correlation Chart
The statistical analysis conducted on geographies consisting of 59,200,277 people shows a weak negative correlation between the proportion of Crow and percentage of population with at least master's degree education in the United States with a correlation coefficient (R) of -0.252 and weighted average of 10.6%. Similarly, the statistical analysis conducted on geographies consisting of 322,506,731 people shows a substantial negative correlation between the proportion of Immigrants from Honduras and percentage of population with at least master's degree education in the United States with a correlation coefficient (R) of -0.589 and weighted average of 11.8%, a difference of 10.6%.
Master's Degree Correlation Summary
| Measurement | Crow | Immigrants from Honduras |
| Minimum | 1.4% | 1.1% |
| Maximum | 15.0% | 16.7% |
| Range | 13.6% | 15.6% |
| Mean | 7.2% | 7.7% |
| Median | 6.2% | 7.9% |
| Interquartile 25% (IQ1) | 4.3% | 4.4% |
| Interquartile 75% (IQ3) | 9.3% | 10.6% |
| Interquartile Range (IQR) | 5.0% | 6.2% |
| Standard Deviation (Sample) | 3.9% | 4.0% |
| Standard Deviation (Population) | 3.8% | 3.9% |
Similar Demographics by Master's Degree
Demographics Similar to Crow by Master's Degree
In terms of master's degree, the demographic groups most similar to Crow are Dutch West Indian (10.6%, a difference of 0.040%), Sioux (10.7%, a difference of 0.39%), Pennsylvania German (10.7%, a difference of 1.0%), Inupiat (10.5%, a difference of 1.1%), and Creek (10.5%, a difference of 1.1%).
| Demographics | Rating | Rank | Master's Degree |
| Hispanics or Latinos | 0.0 /100 | #316 | Tragic 10.9% |
| Hopi | 0.0 /100 | #317 | Tragic 10.9% |
| Immigrants | Cuba | 0.0 /100 | #318 | Tragic 10.9% |
| Kiowa | 0.0 /100 | #319 | Tragic 10.8% |
| Immigrants | Micronesia | 0.0 /100 | #320 | Tragic 10.8% |
| Pennsylvania Germans | 0.0 /100 | #321 | Tragic 10.7% |
| Sioux | 0.0 /100 | #322 | Tragic 10.7% |
| Crow | 0.0 /100 | #323 | Tragic 10.6% |
| Dutch West Indians | 0.0 /100 | #324 | Tragic 10.6% |
| Inupiat | 0.0 /100 | #325 | Tragic 10.5% |
| Creek | 0.0 /100 | #326 | Tragic 10.5% |
| Paiute | 0.0 /100 | #327 | Tragic 10.5% |
| Bangladeshis | 0.0 /100 | #328 | Tragic 10.5% |
| Nepalese | 0.0 /100 | #329 | Tragic 10.5% |
| Fijians | 0.0 /100 | #330 | Tragic 10.3% |
Demographics Similar to Immigrants from Honduras by Master's Degree
In terms of master's degree, the demographic groups most similar to Immigrants from Honduras are Guatemalan (11.7%, a difference of 0.080%), Immigrants from Haiti (11.8%, a difference of 0.17%), Ute (11.7%, a difference of 0.32%), Aleut (11.8%, a difference of 0.36%), and Immigrants from Nicaragua (11.8%, a difference of 0.72%).
| Demographics | Rating | Rank | Master's Degree |
| Malaysians | 0.2 /100 | #281 | Tragic 12.0% |
| Immigrants | El Salvador | 0.2 /100 | #282 | Tragic 12.0% |
| Hondurans | 0.2 /100 | #283 | Tragic 11.9% |
| Ottawa | 0.2 /100 | #284 | Tragic 11.9% |
| Immigrants | Nicaragua | 0.2 /100 | #285 | Tragic 11.8% |
| Aleuts | 0.1 /100 | #286 | Tragic 11.8% |
| Immigrants | Haiti | 0.1 /100 | #287 | Tragic 11.8% |
| Immigrants | Honduras | 0.1 /100 | #288 | Tragic 11.8% |
| Guatemalans | 0.1 /100 | #289 | Tragic 11.7% |
| Ute | 0.1 /100 | #290 | Tragic 11.7% |
| Colville | 0.1 /100 | #291 | Tragic 11.6% |
| Immigrants | Guatemala | 0.1 /100 | #292 | Tragic 11.6% |
| Alaska Natives | 0.1 /100 | #293 | Tragic 11.6% |
| Hawaiians | 0.1 /100 | #294 | Tragic 11.6% |
| Marshallese | 0.1 /100 | #295 | Tragic 11.6% |