Crow vs Immigrants from North America Master's Degree
COMPARE
Crow
Immigrants from North America
Master's Degree
Master's Degree Comparison
Crow
Immigrants from North America
10.6%
MASTER'S DEGREE
0.0/ 100
METRIC RATING
323rd/ 347
METRIC RANK
17.2%
MASTER'S DEGREE
99.1/ 100
METRIC RATING
92nd/ 347
METRIC RANK
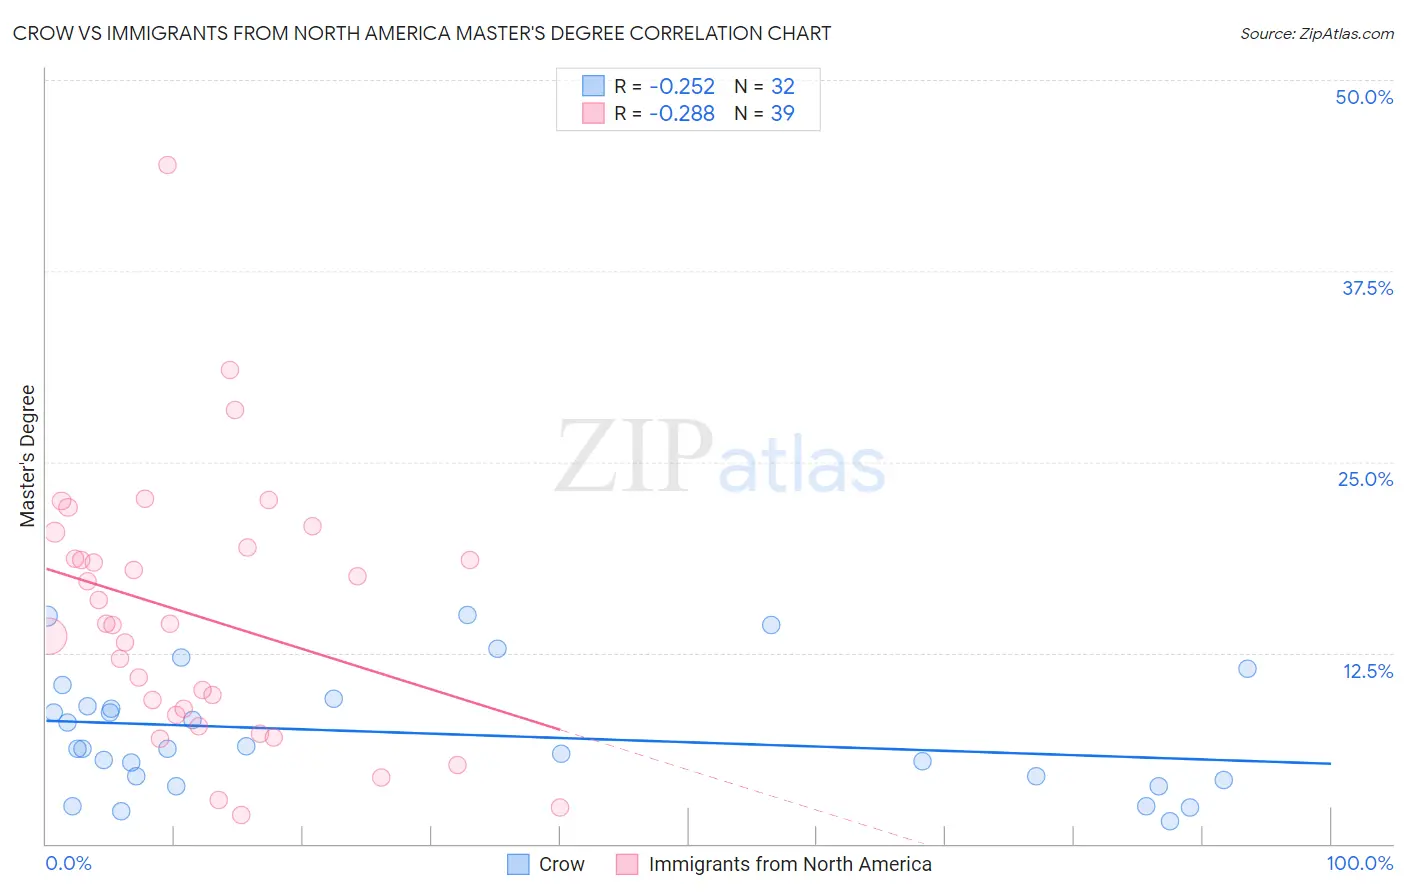
Crow vs Immigrants from North America Master's Degree Correlation Chart
The statistical analysis conducted on geographies consisting of 59,200,277 people shows a weak negative correlation between the proportion of Crow and percentage of population with at least master's degree education in the United States with a correlation coefficient (R) of -0.252 and weighted average of 10.6%. Similarly, the statistical analysis conducted on geographies consisting of 462,287,354 people shows a weak negative correlation between the proportion of Immigrants from North America and percentage of population with at least master's degree education in the United States with a correlation coefficient (R) of -0.288 and weighted average of 17.2%, a difference of 61.4%.
Master's Degree Correlation Summary
| Measurement | Crow | Immigrants from North America |
| Minimum | 1.4% | 1.9% |
| Maximum | 15.0% | 44.5% |
| Range | 13.6% | 42.5% |
| Mean | 7.2% | 14.9% |
| Median | 6.2% | 14.4% |
| Interquartile 25% (IQ1) | 4.3% | 8.4% |
| Interquartile 75% (IQ3) | 9.3% | 19.4% |
| Interquartile Range (IQR) | 5.0% | 11.0% |
| Standard Deviation (Sample) | 3.9% | 8.6% |
| Standard Deviation (Population) | 3.8% | 8.5% |
Similar Demographics by Master's Degree
Demographics Similar to Crow by Master's Degree
In terms of master's degree, the demographic groups most similar to Crow are Dutch West Indian (10.6%, a difference of 0.040%), Sioux (10.7%, a difference of 0.39%), Pennsylvania German (10.7%, a difference of 1.0%), Inupiat (10.5%, a difference of 1.1%), and Creek (10.5%, a difference of 1.1%).
| Demographics | Rating | Rank | Master's Degree |
| Hispanics or Latinos | 0.0 /100 | #316 | Tragic 10.9% |
| Hopi | 0.0 /100 | #317 | Tragic 10.9% |
| Immigrants | Cuba | 0.0 /100 | #318 | Tragic 10.9% |
| Kiowa | 0.0 /100 | #319 | Tragic 10.8% |
| Immigrants | Micronesia | 0.0 /100 | #320 | Tragic 10.8% |
| Pennsylvania Germans | 0.0 /100 | #321 | Tragic 10.7% |
| Sioux | 0.0 /100 | #322 | Tragic 10.7% |
| Crow | 0.0 /100 | #323 | Tragic 10.6% |
| Dutch West Indians | 0.0 /100 | #324 | Tragic 10.6% |
| Inupiat | 0.0 /100 | #325 | Tragic 10.5% |
| Creek | 0.0 /100 | #326 | Tragic 10.5% |
| Paiute | 0.0 /100 | #327 | Tragic 10.5% |
| Bangladeshis | 0.0 /100 | #328 | Tragic 10.5% |
| Nepalese | 0.0 /100 | #329 | Tragic 10.5% |
| Fijians | 0.0 /100 | #330 | Tragic 10.3% |
Demographics Similar to Immigrants from North America by Master's Degree
In terms of master's degree, the demographic groups most similar to Immigrants from North America are Romanian (17.2%, a difference of 0.050%), Immigrants from Italy (17.2%, a difference of 0.060%), Immigrants from Egypt (17.2%, a difference of 0.12%), Bhutanese (17.2%, a difference of 0.14%), and Ugandan (17.1%, a difference of 0.19%).
| Demographics | Rating | Rank | Master's Degree |
| Immigrants | Brazil | 99.4 /100 | #85 | Exceptional 17.4% |
| Immigrants | Croatia | 99.3 /100 | #86 | Exceptional 17.3% |
| Maltese | 99.3 /100 | #87 | Exceptional 17.3% |
| Immigrants | Canada | 99.2 /100 | #88 | Exceptional 17.2% |
| Bhutanese | 99.1 /100 | #89 | Exceptional 17.2% |
| Immigrants | Egypt | 99.1 /100 | #90 | Exceptional 17.2% |
| Romanians | 99.1 /100 | #91 | Exceptional 17.2% |
| Immigrants | North America | 99.1 /100 | #92 | Exceptional 17.2% |
| Immigrants | Italy | 99.1 /100 | #93 | Exceptional 17.2% |
| Ugandans | 99.0 /100 | #94 | Exceptional 17.1% |
| Immigrants | Morocco | 98.9 /100 | #95 | Exceptional 17.1% |
| Immigrants | Northern Africa | 98.9 /100 | #96 | Exceptional 17.1% |
| Immigrants | England | 98.8 /100 | #97 | Exceptional 17.0% |
| Immigrants | Ukraine | 98.8 /100 | #98 | Exceptional 17.0% |
| Laotians | 98.8 /100 | #99 | Exceptional 17.0% |