Crow vs Immigrants from Grenada Master's Degree
COMPARE
Crow
Immigrants from Grenada
Master's Degree
Master's Degree Comparison
Crow
Immigrants from Grenada
10.6%
MASTER'S DEGREE
0.0/ 100
METRIC RATING
323rd/ 347
METRIC RANK
14.0%
MASTER'S DEGREE
11.8/ 100
METRIC RATING
224th/ 347
METRIC RANK
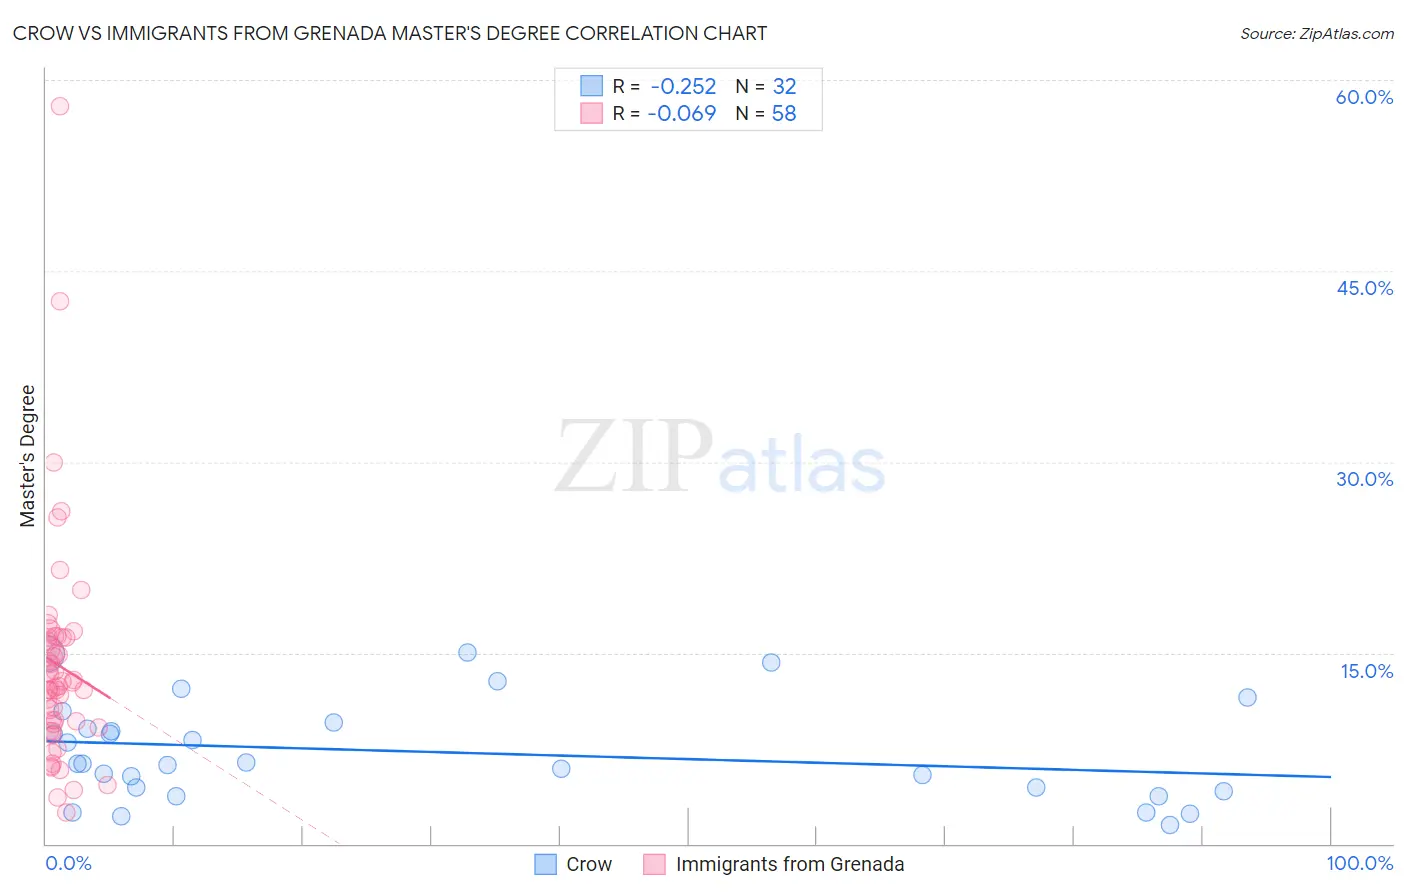
Crow vs Immigrants from Grenada Master's Degree Correlation Chart
The statistical analysis conducted on geographies consisting of 59,200,277 people shows a weak negative correlation between the proportion of Crow and percentage of population with at least master's degree education in the United States with a correlation coefficient (R) of -0.252 and weighted average of 10.6%. Similarly, the statistical analysis conducted on geographies consisting of 67,201,096 people shows a slight negative correlation between the proportion of Immigrants from Grenada and percentage of population with at least master's degree education in the United States with a correlation coefficient (R) of -0.069 and weighted average of 14.0%, a difference of 31.3%.
Master's Degree Correlation Summary
| Measurement | Crow | Immigrants from Grenada |
| Minimum | 1.4% | 2.4% |
| Maximum | 15.0% | 57.9% |
| Range | 13.6% | 55.5% |
| Mean | 7.2% | 14.0% |
| Median | 6.2% | 12.5% |
| Interquartile 25% (IQ1) | 4.3% | 9.5% |
| Interquartile 75% (IQ3) | 9.3% | 16.2% |
| Interquartile Range (IQR) | 5.0% | 6.7% |
| Standard Deviation (Sample) | 3.9% | 8.9% |
| Standard Deviation (Population) | 3.8% | 8.8% |
Similar Demographics by Master's Degree
Demographics Similar to Crow by Master's Degree
In terms of master's degree, the demographic groups most similar to Crow are Dutch West Indian (10.6%, a difference of 0.040%), Sioux (10.7%, a difference of 0.39%), Pennsylvania German (10.7%, a difference of 1.0%), Inupiat (10.5%, a difference of 1.1%), and Creek (10.5%, a difference of 1.1%).
| Demographics | Rating | Rank | Master's Degree |
| Hispanics or Latinos | 0.0 /100 | #316 | Tragic 10.9% |
| Hopi | 0.0 /100 | #317 | Tragic 10.9% |
| Immigrants | Cuba | 0.0 /100 | #318 | Tragic 10.9% |
| Kiowa | 0.0 /100 | #319 | Tragic 10.8% |
| Immigrants | Micronesia | 0.0 /100 | #320 | Tragic 10.8% |
| Pennsylvania Germans | 0.0 /100 | #321 | Tragic 10.7% |
| Sioux | 0.0 /100 | #322 | Tragic 10.7% |
| Crow | 0.0 /100 | #323 | Tragic 10.6% |
| Dutch West Indians | 0.0 /100 | #324 | Tragic 10.6% |
| Inupiat | 0.0 /100 | #325 | Tragic 10.5% |
| Creek | 0.0 /100 | #326 | Tragic 10.5% |
| Paiute | 0.0 /100 | #327 | Tragic 10.5% |
| Bangladeshis | 0.0 /100 | #328 | Tragic 10.5% |
| Nepalese | 0.0 /100 | #329 | Tragic 10.5% |
| Fijians | 0.0 /100 | #330 | Tragic 10.3% |
Demographics Similar to Immigrants from Grenada by Master's Degree
In terms of master's degree, the demographic groups most similar to Immigrants from Grenada are Immigrants from South Eastern Asia (14.0%, a difference of 0.050%), Portuguese (13.9%, a difference of 0.21%), Ecuadorian (14.0%, a difference of 0.25%), Immigrants from St. Vincent and the Grenadines (13.9%, a difference of 0.26%), and Korean (14.0%, a difference of 0.28%).
| Demographics | Rating | Rank | Master's Degree |
| Immigrants | Trinidad and Tobago | 15.8 /100 | #217 | Poor 14.1% |
| French Canadians | 14.9 /100 | #218 | Poor 14.1% |
| Norwegians | 13.6 /100 | #219 | Poor 14.0% |
| Germans | 13.1 /100 | #220 | Poor 14.0% |
| Koreans | 12.7 /100 | #221 | Poor 14.0% |
| Ecuadorians | 12.6 /100 | #222 | Poor 14.0% |
| Immigrants | South Eastern Asia | 11.9 /100 | #223 | Poor 14.0% |
| Immigrants | Grenada | 11.8 /100 | #224 | Poor 14.0% |
| Portuguese | 11.2 /100 | #225 | Poor 13.9% |
| Immigrants | St. Vincent and the Grenadines | 11.0 /100 | #226 | Poor 13.9% |
| Immigrants | West Indies | 9.8 /100 | #227 | Tragic 13.9% |
| Whites/Caucasians | 9.1 /100 | #228 | Tragic 13.8% |
| British West Indians | 8.8 /100 | #229 | Tragic 13.8% |
| Dutch | 8.7 /100 | #230 | Tragic 13.8% |
| Guyanese | 7.6 /100 | #231 | Tragic 13.7% |