Crow vs Latvian Associate's Degree
COMPARE
Crow
Latvian
Associate's Degree
Associate's Degree Comparison
Crow
Latvians
37.6%
ASSOCIATE'S DEGREE
0.0/ 100
METRIC RATING
316th/ 347
METRIC RANK
53.9%
ASSOCIATE'S DEGREE
100.0/ 100
METRIC RATING
27th/ 347
METRIC RANK
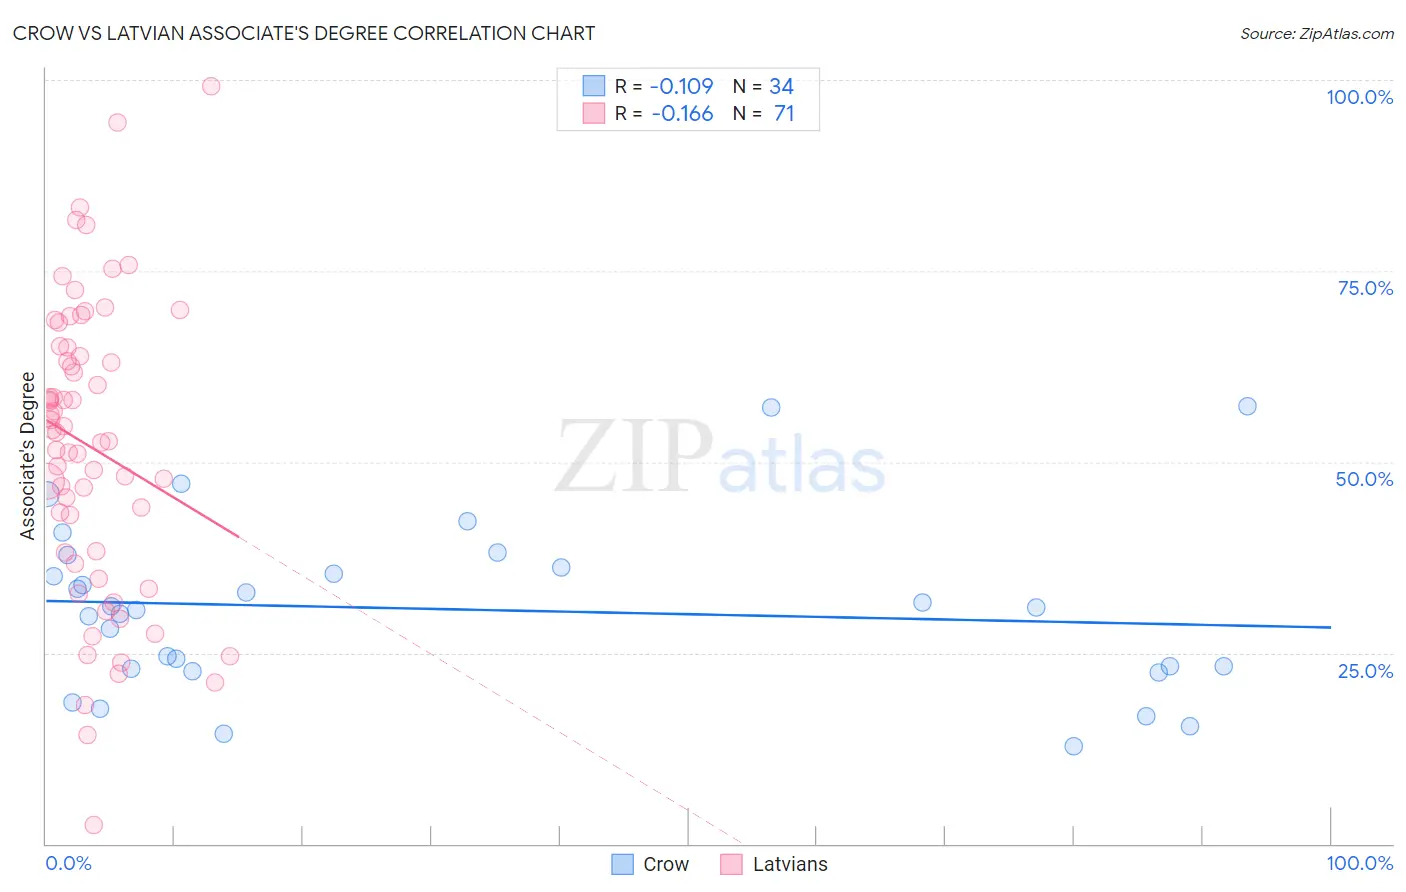
Crow vs Latvian Associate's Degree Correlation Chart
The statistical analysis conducted on geographies consisting of 59,209,492 people shows a poor negative correlation between the proportion of Crow and percentage of population with at least associate's degree education in the United States with a correlation coefficient (R) of -0.109 and weighted average of 37.6%. Similarly, the statistical analysis conducted on geographies consisting of 220,726,880 people shows a poor negative correlation between the proportion of Latvians and percentage of population with at least associate's degree education in the United States with a correlation coefficient (R) of -0.166 and weighted average of 53.9%, a difference of 43.6%.
Associate's Degree Correlation Summary
| Measurement | Crow | Latvian |
| Minimum | 12.8% | 2.4% |
| Maximum | 57.2% | 99.2% |
| Range | 44.4% | 96.7% |
| Mean | 30.7% | 51.9% |
| Median | 30.8% | 53.9% |
| Interquartile 25% (IQ1) | 22.8% | 38.1% |
| Interquartile 75% (IQ3) | 36.1% | 64.9% |
| Interquartile Range (IQR) | 13.3% | 26.9% |
| Standard Deviation (Sample) | 11.1% | 19.2% |
| Standard Deviation (Population) | 10.9% | 19.1% |
Similar Demographics by Associate's Degree
Demographics Similar to Crow by Associate's Degree
In terms of associate's degree, the demographic groups most similar to Crow are Creek (37.6%, a difference of 0.010%), Yaqui (37.6%, a difference of 0.020%), Alaska Native (37.5%, a difference of 0.25%), Seminole (37.7%, a difference of 0.40%), and Hispanic or Latino (37.7%, a difference of 0.45%).
| Demographics | Rating | Rank | Associate's Degree |
| Immigrants | Guatemala | 0.0 /100 | #309 | Tragic 38.1% |
| Immigrants | Dominican Republic | 0.0 /100 | #310 | Tragic 37.9% |
| Immigrants | Latin America | 0.0 /100 | #311 | Tragic 37.9% |
| Choctaw | 0.0 /100 | #312 | Tragic 37.8% |
| Hispanics or Latinos | 0.0 /100 | #313 | Tragic 37.7% |
| Seminole | 0.0 /100 | #314 | Tragic 37.7% |
| Creek | 0.0 /100 | #315 | Tragic 37.6% |
| Crow | 0.0 /100 | #316 | Tragic 37.6% |
| Yaqui | 0.0 /100 | #317 | Tragic 37.6% |
| Alaska Natives | 0.0 /100 | #318 | Tragic 37.5% |
| Fijians | 0.0 /100 | #319 | Tragic 37.4% |
| Cajuns | 0.0 /100 | #320 | Tragic 37.4% |
| Immigrants | Yemen | 0.0 /100 | #321 | Tragic 37.3% |
| Pennsylvania Germans | 0.0 /100 | #322 | Tragic 37.2% |
| Immigrants | Cabo Verde | 0.0 /100 | #323 | Tragic 36.8% |
Demographics Similar to Latvians by Associate's Degree
In terms of associate's degree, the demographic groups most similar to Latvians are Turkish (53.9%, a difference of 0.070%), Immigrants from France (53.9%, a difference of 0.090%), Immigrants from Sri Lanka (53.7%, a difference of 0.50%), Immigrants from Northern Europe (53.5%, a difference of 0.87%), and Immigrants from Turkey (53.4%, a difference of 0.90%).
| Demographics | Rating | Rank | Associate's Degree |
| Cambodians | 100.0 /100 | #20 | Exceptional 54.6% |
| Immigrants | Sweden | 100.0 /100 | #21 | Exceptional 54.6% |
| Immigrants | Japan | 100.0 /100 | #22 | Exceptional 54.6% |
| Burmese | 100.0 /100 | #23 | Exceptional 54.6% |
| Immigrants | Korea | 100.0 /100 | #24 | Exceptional 54.5% |
| Immigrants | Switzerland | 100.0 /100 | #25 | Exceptional 54.5% |
| Immigrants | Belgium | 100.0 /100 | #26 | Exceptional 54.5% |
| Latvians | 100.0 /100 | #27 | Exceptional 53.9% |
| Turks | 100.0 /100 | #28 | Exceptional 53.9% |
| Immigrants | France | 100.0 /100 | #29 | Exceptional 53.9% |
| Immigrants | Sri Lanka | 100.0 /100 | #30 | Exceptional 53.7% |
| Immigrants | Northern Europe | 100.0 /100 | #31 | Exceptional 53.5% |
| Immigrants | Turkey | 100.0 /100 | #32 | Exceptional 53.4% |
| Israelis | 100.0 /100 | #33 | Exceptional 53.4% |
| Bulgarians | 100.0 /100 | #34 | Exceptional 53.3% |