Crow vs Latvian Female Disability
COMPARE
Crow
Latvian
Female Disability
Female Disability Comparison
Crow
Latvians
12.7%
FEMALE DISABILITY
1.6/ 100
METRIC RATING
251st/ 347
METRIC RANK
11.7%
FEMALE DISABILITY
98.2/ 100
METRIC RATING
107th/ 347
METRIC RANK
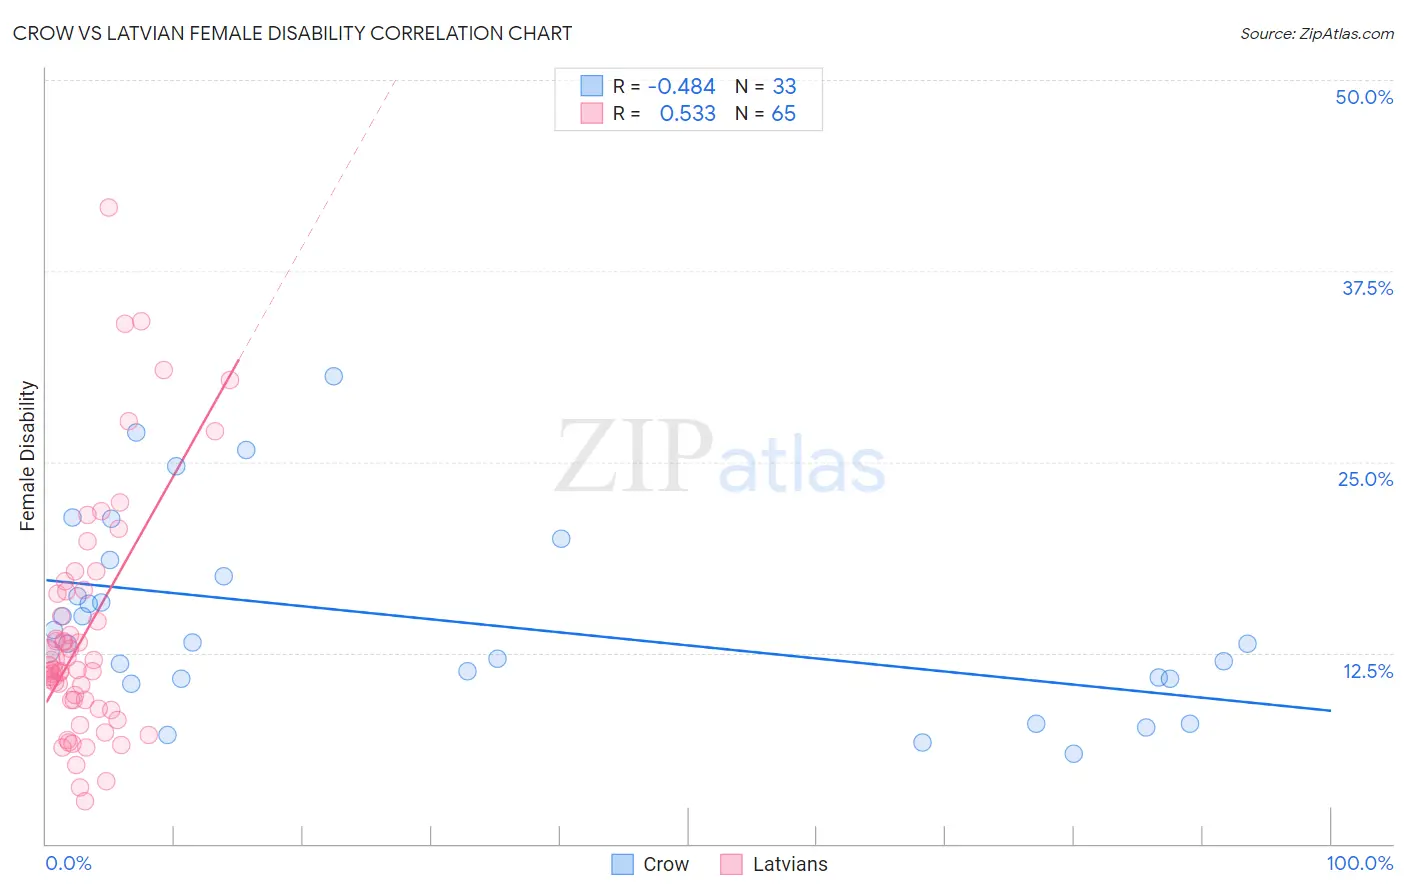
Crow vs Latvian Female Disability Correlation Chart
The statistical analysis conducted on geographies consisting of 59,203,851 people shows a moderate negative correlation between the proportion of Crow and percentage of females with a disability in the United States with a correlation coefficient (R) of -0.484 and weighted average of 12.7%. Similarly, the statistical analysis conducted on geographies consisting of 220,713,826 people shows a substantial positive correlation between the proportion of Latvians and percentage of females with a disability in the United States with a correlation coefficient (R) of 0.533 and weighted average of 11.7%, a difference of 8.0%.
Female Disability Correlation Summary
| Measurement | Crow | Latvian |
| Minimum | 5.9% | 2.8% |
| Maximum | 30.6% | 41.7% |
| Range | 24.7% | 38.8% |
| Mean | 14.6% | 13.9% |
| Median | 13.1% | 11.4% |
| Interquartile 25% (IQ1) | 10.8% | 9.1% |
| Interquartile 75% (IQ3) | 18.0% | 16.6% |
| Interquartile Range (IQR) | 7.2% | 7.5% |
| Standard Deviation (Sample) | 6.2% | 7.9% |
| Standard Deviation (Population) | 6.1% | 7.8% |
Similar Demographics by Female Disability
Demographics Similar to Crow by Female Disability
In terms of female disability, the demographic groups most similar to Crow are Slovene (12.7%, a difference of 0.060%), Immigrants from Caribbean (12.7%, a difference of 0.080%), Jamaican (12.7%, a difference of 0.090%), Immigrants from Congo (12.7%, a difference of 0.10%), and Hawaiian (12.7%, a difference of 0.12%).
| Demographics | Rating | Rank | Female Disability |
| Alsatians | 2.5 /100 | #244 | Tragic 12.6% |
| Immigrants | Jamaica | 2.2 /100 | #245 | Tragic 12.6% |
| Spanish American Indians | 2.1 /100 | #246 | Tragic 12.6% |
| Menominee | 2.1 /100 | #247 | Tragic 12.6% |
| Carpatho Rusyns | 2.0 /100 | #248 | Tragic 12.6% |
| Immigrants | Congo | 1.8 /100 | #249 | Tragic 12.7% |
| Slovenes | 1.7 /100 | #250 | Tragic 12.7% |
| Crow | 1.6 /100 | #251 | Tragic 12.7% |
| Immigrants | Caribbean | 1.4 /100 | #252 | Tragic 12.7% |
| Jamaicans | 1.4 /100 | #253 | Tragic 12.7% |
| Hawaiians | 1.4 /100 | #254 | Tragic 12.7% |
| Immigrants | Germany | 1.3 /100 | #255 | Tragic 12.7% |
| British West Indians | 1.2 /100 | #256 | Tragic 12.7% |
| Liberians | 1.1 /100 | #257 | Tragic 12.7% |
| Aleuts | 1.1 /100 | #258 | Tragic 12.7% |
Demographics Similar to Latvians by Female Disability
In terms of female disability, the demographic groups most similar to Latvians are Immigrants from Greece (11.7%, a difference of 0.020%), New Zealander (11.7%, a difference of 0.020%), Australian (11.7%, a difference of 0.050%), Immigrants (11.7%, a difference of 0.050%), and Soviet Union (11.7%, a difference of 0.050%).
| Demographics | Rating | Rank | Female Disability |
| Immigrants | Uruguay | 98.5 /100 | #100 | Exceptional 11.7% |
| Immigrants | Costa Rica | 98.4 /100 | #101 | Exceptional 11.7% |
| Immigrants | South Eastern Asia | 98.4 /100 | #102 | Exceptional 11.7% |
| Immigrants | Eastern Africa | 98.3 /100 | #103 | Exceptional 11.7% |
| Immigrants | Western Asia | 98.3 /100 | #104 | Exceptional 11.7% |
| Australians | 98.3 /100 | #105 | Exceptional 11.7% |
| Immigrants | Greece | 98.2 /100 | #106 | Exceptional 11.7% |
| Latvians | 98.2 /100 | #107 | Exceptional 11.7% |
| New Zealanders | 98.1 /100 | #108 | Exceptional 11.7% |
| Immigrants | Immigrants | 98.1 /100 | #109 | Exceptional 11.7% |
| Soviet Union | 98.1 /100 | #110 | Exceptional 11.7% |
| Costa Ricans | 98.1 /100 | #111 | Exceptional 11.7% |
| Immigrants | Bangladesh | 97.8 /100 | #112 | Exceptional 11.8% |
| Immigrants | Belarus | 97.8 /100 | #113 | Exceptional 11.8% |
| South Africans | 97.7 /100 | #114 | Exceptional 11.8% |