Immigrants from Cambodia vs Latvian Master's Degree
COMPARE
Immigrants from Cambodia
Latvian
Master's Degree
Master's Degree Comparison
Immigrants from Cambodia
Latvians
12.9%
MASTER'S DEGREE
1.4/ 100
METRIC RATING
246th/ 347
METRIC RANK
19.8%
MASTER'S DEGREE
100.0/ 100
METRIC RATING
29th/ 347
METRIC RANK
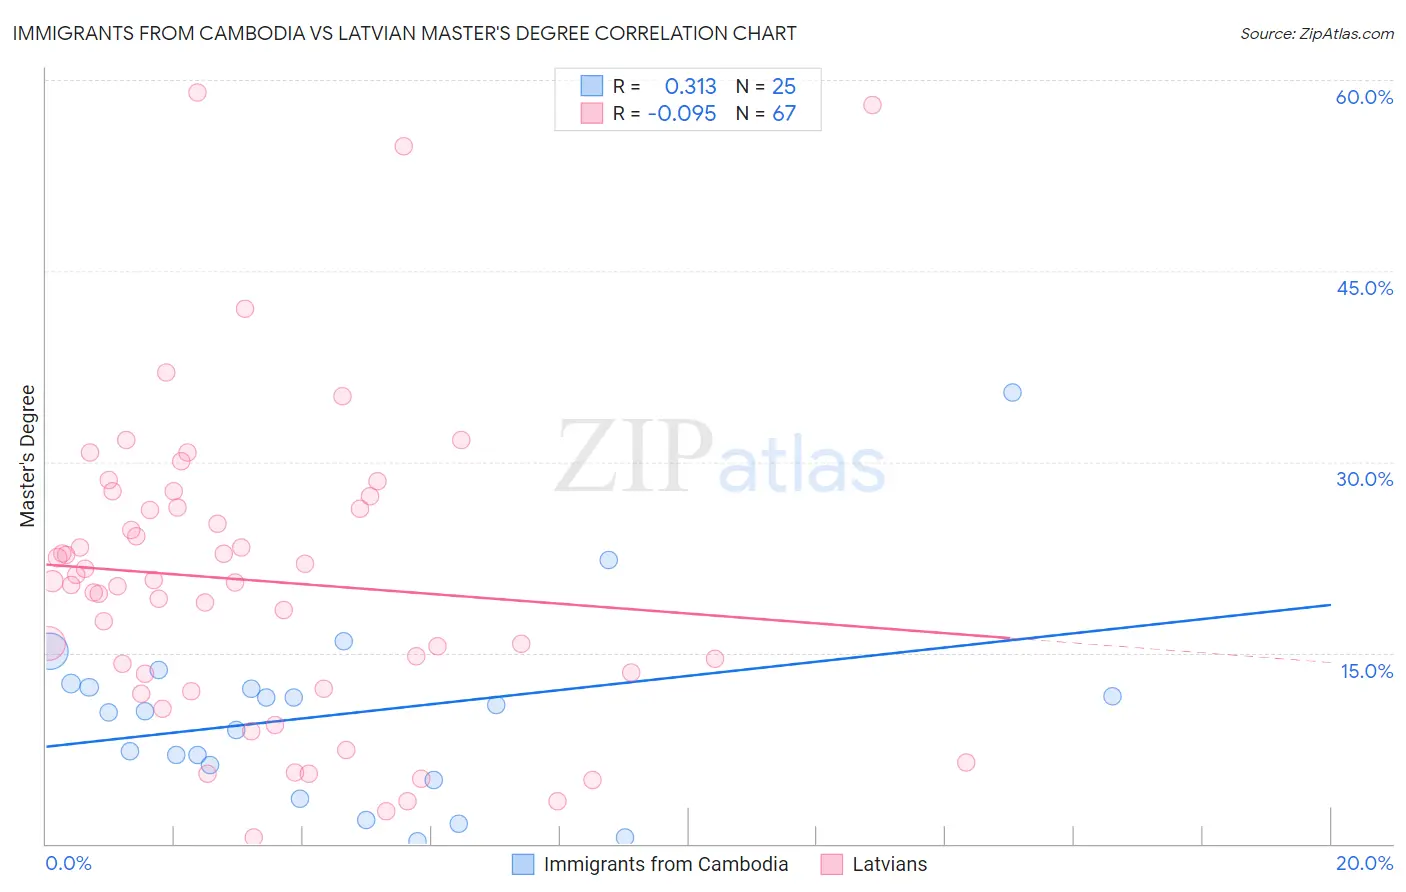
Immigrants from Cambodia vs Latvian Master's Degree Correlation Chart
The statistical analysis conducted on geographies consisting of 205,124,536 people shows a mild positive correlation between the proportion of Immigrants from Cambodia and percentage of population with at least master's degree education in the United States with a correlation coefficient (R) of 0.313 and weighted average of 12.9%. Similarly, the statistical analysis conducted on geographies consisting of 220,706,916 people shows a slight negative correlation between the proportion of Latvians and percentage of population with at least master's degree education in the United States with a correlation coefficient (R) of -0.095 and weighted average of 19.8%, a difference of 53.6%.
Master's Degree Correlation Summary
| Measurement | Immigrants from Cambodia | Latvian |
| Minimum | 0.16% | 0.45% |
| Maximum | 35.5% | 59.0% |
| Range | 35.3% | 58.6% |
| Mean | 10.2% | 20.7% |
| Median | 10.4% | 20.5% |
| Interquartile 25% (IQ1) | 5.6% | 12.2% |
| Interquartile 75% (IQ3) | 12.5% | 26.5% |
| Interquartile Range (IQR) | 6.9% | 14.3% |
| Standard Deviation (Sample) | 7.4% | 12.2% |
| Standard Deviation (Population) | 7.3% | 12.1% |
Similar Demographics by Master's Degree
Demographics Similar to Immigrants from Cambodia by Master's Degree
In terms of master's degree, the demographic groups most similar to Immigrants from Cambodia are Iroquois (12.9%, a difference of 0.030%), Immigrants from Bahamas (12.9%, a difference of 0.040%), African (12.9%, a difference of 0.12%), Cree (12.8%, a difference of 0.43%), and Liberian (12.8%, a difference of 0.44%).
| Demographics | Rating | Rank | Master's Degree |
| Immigrants | Nonimmigrants | 3.4 /100 | #239 | Tragic 13.3% |
| Guamanians/Chamorros | 2.2 /100 | #240 | Tragic 13.1% |
| U.S. Virgin Islanders | 2.1 /100 | #241 | Tragic 13.1% |
| Spanish Americans | 1.9 /100 | #242 | Tragic 13.0% |
| Immigrants | Jamaica | 1.9 /100 | #243 | Tragic 13.0% |
| Delaware | 1.7 /100 | #244 | Tragic 13.0% |
| Immigrants | Bahamas | 1.4 /100 | #245 | Tragic 12.9% |
| Immigrants | Cambodia | 1.4 /100 | #246 | Tragic 12.9% |
| Iroquois | 1.4 /100 | #247 | Tragic 12.9% |
| Africans | 1.4 /100 | #248 | Tragic 12.9% |
| Cree | 1.3 /100 | #249 | Tragic 12.8% |
| Liberians | 1.3 /100 | #250 | Tragic 12.8% |
| Tlingit-Haida | 1.3 /100 | #251 | Tragic 12.8% |
| French American Indians | 1.0 /100 | #252 | Tragic 12.7% |
| Immigrants | Dominica | 0.8 /100 | #253 | Tragic 12.6% |
Demographics Similar to Latvians by Master's Degree
In terms of master's degree, the demographic groups most similar to Latvians are Turkish (19.9%, a difference of 0.41%), Immigrants from Sri Lanka (19.9%, a difference of 0.48%), Immigrants from Turkey (19.7%, a difference of 0.50%), Immigrants from Korea (19.7%, a difference of 0.52%), and Burmese (19.7%, a difference of 0.58%).
| Demographics | Rating | Rank | Master's Degree |
| Israelis | 100.0 /100 | #22 | Exceptional 20.3% |
| Immigrants | France | 100.0 /100 | #23 | Exceptional 20.3% |
| Immigrants | Sweden | 100.0 /100 | #24 | Exceptional 20.3% |
| Immigrants | Japan | 100.0 /100 | #25 | Exceptional 20.0% |
| Cambodians | 100.0 /100 | #26 | Exceptional 20.0% |
| Immigrants | Sri Lanka | 100.0 /100 | #27 | Exceptional 19.9% |
| Turks | 100.0 /100 | #28 | Exceptional 19.9% |
| Latvians | 100.0 /100 | #29 | Exceptional 19.8% |
| Immigrants | Turkey | 100.0 /100 | #30 | Exceptional 19.7% |
| Immigrants | Korea | 100.0 /100 | #31 | Exceptional 19.7% |
| Burmese | 100.0 /100 | #32 | Exceptional 19.7% |
| Russians | 100.0 /100 | #33 | Exceptional 19.5% |
| Immigrants | Denmark | 100.0 /100 | #34 | Exceptional 19.5% |
| Immigrants | Northern Europe | 100.0 /100 | #35 | Exceptional 19.5% |
| Immigrants | Russia | 100.0 /100 | #36 | Exceptional 19.4% |