Crow vs Jamaican Master's Degree
COMPARE
Crow
Jamaican
Master's Degree
Master's Degree Comparison
Crow
Jamaicans
10.6%
MASTER'S DEGREE
0.0/ 100
METRIC RATING
323rd/ 347
METRIC RANK
13.4%
MASTER'S DEGREE
4.1/ 100
METRIC RATING
237th/ 347
METRIC RANK
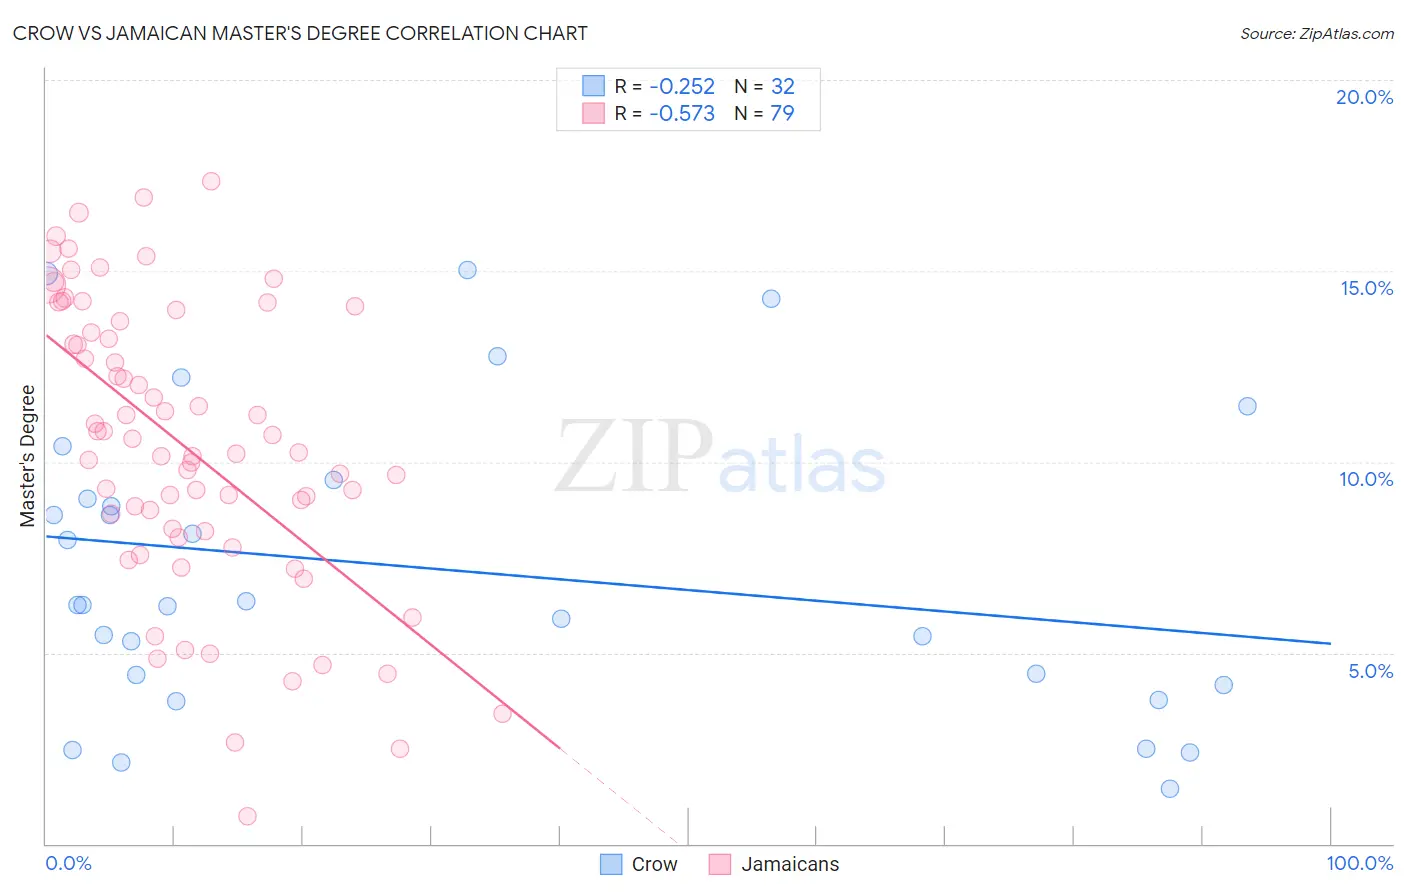
Crow vs Jamaican Master's Degree Correlation Chart
The statistical analysis conducted on geographies consisting of 59,200,277 people shows a weak negative correlation between the proportion of Crow and percentage of population with at least master's degree education in the United States with a correlation coefficient (R) of -0.252 and weighted average of 10.6%. Similarly, the statistical analysis conducted on geographies consisting of 367,857,102 people shows a substantial negative correlation between the proportion of Jamaicans and percentage of population with at least master's degree education in the United States with a correlation coefficient (R) of -0.573 and weighted average of 13.4%, a difference of 26.2%.
Master's Degree Correlation Summary
| Measurement | Crow | Jamaican |
| Minimum | 1.4% | 0.72% |
| Maximum | 15.0% | 17.3% |
| Range | 13.6% | 16.6% |
| Mean | 7.2% | 10.4% |
| Median | 6.2% | 10.2% |
| Interquartile 25% (IQ1) | 4.3% | 8.2% |
| Interquartile 75% (IQ3) | 9.3% | 13.7% |
| Interquartile Range (IQR) | 5.0% | 5.5% |
| Standard Deviation (Sample) | 3.9% | 3.8% |
| Standard Deviation (Population) | 3.8% | 3.7% |
Similar Demographics by Master's Degree
Demographics Similar to Crow by Master's Degree
In terms of master's degree, the demographic groups most similar to Crow are Dutch West Indian (10.6%, a difference of 0.040%), Sioux (10.7%, a difference of 0.39%), Pennsylvania German (10.7%, a difference of 1.0%), Inupiat (10.5%, a difference of 1.1%), and Creek (10.5%, a difference of 1.1%).
| Demographics | Rating | Rank | Master's Degree |
| Hispanics or Latinos | 0.0 /100 | #316 | Tragic 10.9% |
| Hopi | 0.0 /100 | #317 | Tragic 10.9% |
| Immigrants | Cuba | 0.0 /100 | #318 | Tragic 10.9% |
| Kiowa | 0.0 /100 | #319 | Tragic 10.8% |
| Immigrants | Micronesia | 0.0 /100 | #320 | Tragic 10.8% |
| Pennsylvania Germans | 0.0 /100 | #321 | Tragic 10.7% |
| Sioux | 0.0 /100 | #322 | Tragic 10.7% |
| Crow | 0.0 /100 | #323 | Tragic 10.6% |
| Dutch West Indians | 0.0 /100 | #324 | Tragic 10.6% |
| Inupiat | 0.0 /100 | #325 | Tragic 10.5% |
| Creek | 0.0 /100 | #326 | Tragic 10.5% |
| Paiute | 0.0 /100 | #327 | Tragic 10.5% |
| Bangladeshis | 0.0 /100 | #328 | Tragic 10.5% |
| Nepalese | 0.0 /100 | #329 | Tragic 10.5% |
| Fijians | 0.0 /100 | #330 | Tragic 10.3% |
Demographics Similar to Jamaicans by Master's Degree
In terms of master's degree, the demographic groups most similar to Jamaicans are Hmong (13.4%, a difference of 0.14%), Immigrants from Guyana (13.4%, a difference of 0.22%), German Russian (13.5%, a difference of 0.34%), Nonimmigrants (13.3%, a difference of 0.67%), and Immigrants from Burma/Myanmar (13.5%, a difference of 0.75%).
| Demographics | Rating | Rank | Master's Degree |
| Dutch | 8.7 /100 | #230 | Tragic 13.8% |
| Guyanese | 7.6 /100 | #231 | Tragic 13.7% |
| Immigrants | Philippines | 6.0 /100 | #232 | Tragic 13.6% |
| Immigrants | Ecuador | 5.7 /100 | #233 | Tragic 13.6% |
| Immigrants | Burma/Myanmar | 5.0 /100 | #234 | Tragic 13.5% |
| German Russians | 4.5 /100 | #235 | Tragic 13.5% |
| Immigrants | Guyana | 4.4 /100 | #236 | Tragic 13.4% |
| Jamaicans | 4.1 /100 | #237 | Tragic 13.4% |
| Hmong | 4.0 /100 | #238 | Tragic 13.4% |
| Immigrants | Nonimmigrants | 3.4 /100 | #239 | Tragic 13.3% |
| Guamanians/Chamorros | 2.2 /100 | #240 | Tragic 13.1% |
| U.S. Virgin Islanders | 2.1 /100 | #241 | Tragic 13.1% |
| Spanish Americans | 1.9 /100 | #242 | Tragic 13.0% |
| Immigrants | Jamaica | 1.9 /100 | #243 | Tragic 13.0% |
| Delaware | 1.7 /100 | #244 | Tragic 13.0% |