Croatian vs Trinidadian and Tobagonian College, 1 year or more
COMPARE
Croatian
Trinidadian and Tobagonian
College, 1 year or more
College, 1 year or more Comparison
Croatians
Trinidadians and Tobagonians
62.2%
COLLEGE, 1 YEAR OR MORE
97.1/ 100
METRIC RATING
99th/ 347
METRIC RANK
55.8%
COLLEGE, 1 YEAR OR MORE
1.1/ 100
METRIC RATING
240th/ 347
METRIC RANK
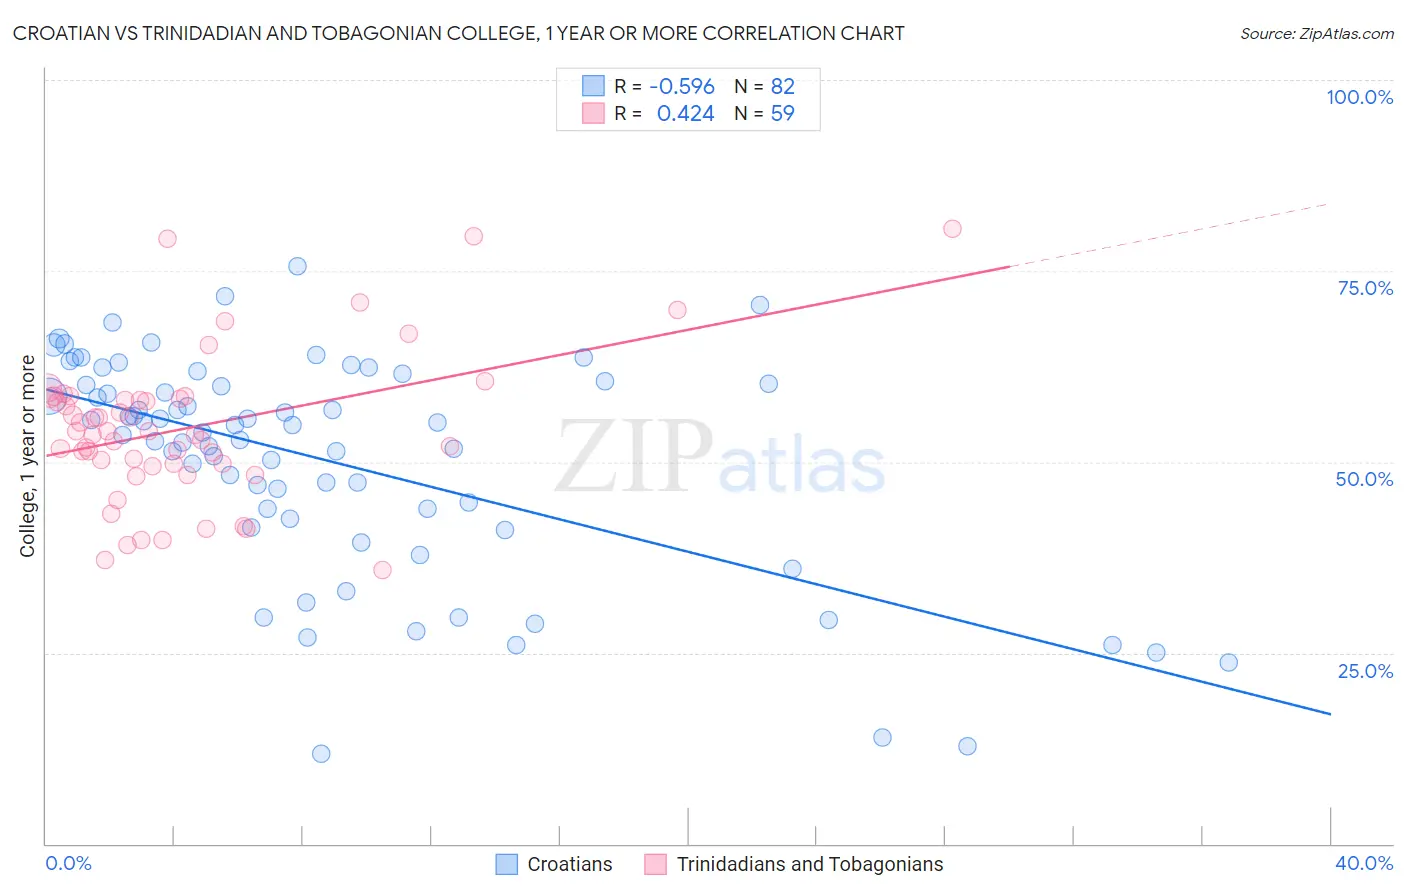
Croatian vs Trinidadian and Tobagonian College, 1 year or more Correlation Chart
The statistical analysis conducted on geographies consisting of 375,729,085 people shows a substantial negative correlation between the proportion of Croatians and percentage of population with at least college, 1 year or more education in the United States with a correlation coefficient (R) of -0.596 and weighted average of 62.2%. Similarly, the statistical analysis conducted on geographies consisting of 219,882,137 people shows a moderate positive correlation between the proportion of Trinidadians and Tobagonians and percentage of population with at least college, 1 year or more education in the United States with a correlation coefficient (R) of 0.424 and weighted average of 55.8%, a difference of 11.4%.
College, 1 year or more Correlation Summary
| Measurement | Croatian | Trinidadian and Tobagonian |
| Minimum | 11.7% | 35.8% |
| Maximum | 75.6% | 80.5% |
| Range | 63.8% | 44.7% |
| Mean | 50.1% | 54.4% |
| Median | 54.4% | 54.0% |
| Interquartile 25% (IQ1) | 42.5% | 49.7% |
| Interquartile 75% (IQ3) | 60.2% | 58.4% |
| Interquartile Range (IQR) | 17.6% | 8.7% |
| Standard Deviation (Sample) | 14.4% | 9.7% |
| Standard Deviation (Population) | 14.3% | 9.6% |
Similar Demographics by College, 1 year or more
Demographics Similar to Croatians by College, 1 year or more
In terms of college, 1 year or more, the demographic groups most similar to Croatians are Carpatho Rusyn (62.2%, a difference of 0.0%), Chinese (62.2%, a difference of 0.010%), Jordanian (62.2%, a difference of 0.010%), British (62.3%, a difference of 0.13%), and Icelander (62.1%, a difference of 0.16%).
| Demographics | Rating | Rank | College, 1 year or more |
| Immigrants | Egypt | 97.8 /100 | #92 | Exceptional 62.4% |
| Romanians | 97.7 /100 | #93 | Exceptional 62.4% |
| Immigrants | Croatia | 97.6 /100 | #94 | Exceptional 62.3% |
| British | 97.4 /100 | #95 | Exceptional 62.3% |
| Chinese | 97.2 /100 | #96 | Exceptional 62.2% |
| Jordanians | 97.2 /100 | #97 | Exceptional 62.2% |
| Carpatho Rusyns | 97.2 /100 | #98 | Exceptional 62.2% |
| Croatians | 97.1 /100 | #99 | Exceptional 62.2% |
| Icelanders | 96.8 /100 | #100 | Exceptional 62.1% |
| Swedes | 96.8 /100 | #101 | Exceptional 62.1% |
| Luxembourgers | 96.7 /100 | #102 | Exceptional 62.1% |
| Afghans | 96.4 /100 | #103 | Exceptional 62.0% |
| Chileans | 96.4 /100 | #104 | Exceptional 62.0% |
| Immigrants | Nepal | 96.3 /100 | #105 | Exceptional 62.0% |
| Palestinians | 96.3 /100 | #106 | Exceptional 62.0% |
Demographics Similar to Trinidadians and Tobagonians by College, 1 year or more
In terms of college, 1 year or more, the demographic groups most similar to Trinidadians and Tobagonians are French American Indian (55.8%, a difference of 0.050%), Puget Sound Salish (55.9%, a difference of 0.090%), Marshallese (55.8%, a difference of 0.15%), Osage (55.8%, a difference of 0.16%), and Chippewa (55.7%, a difference of 0.28%).
| Demographics | Rating | Rank | College, 1 year or more |
| Immigrants | Nonimmigrants | 2.5 /100 | #233 | Tragic 56.5% |
| Spanish Americans | 1.8 /100 | #234 | Tragic 56.3% |
| West Indians | 1.8 /100 | #235 | Tragic 56.3% |
| Iroquois | 1.7 /100 | #236 | Tragic 56.2% |
| Samoans | 1.6 /100 | #237 | Tragic 56.2% |
| Barbadians | 1.3 /100 | #238 | Tragic 56.0% |
| Puget Sound Salish | 1.1 /100 | #239 | Tragic 55.9% |
| Trinidadians and Tobagonians | 1.1 /100 | #240 | Tragic 55.8% |
| French American Indians | 1.0 /100 | #241 | Tragic 55.8% |
| Marshallese | 1.0 /100 | #242 | Tragic 55.8% |
| Osage | 1.0 /100 | #243 | Tragic 55.8% |
| Chippewa | 0.9 /100 | #244 | Tragic 55.7% |
| Immigrants | Liberia | 0.8 /100 | #245 | Tragic 55.7% |
| Malaysians | 0.8 /100 | #246 | Tragic 55.6% |
| Hawaiians | 0.8 /100 | #247 | Tragic 55.6% |