Tongan vs Trinidadian and Tobagonian College, 1 year or more
COMPARE
Tongan
Trinidadian and Tobagonian
College, 1 year or more
College, 1 year or more Comparison
Tongans
Trinidadians and Tobagonians
57.8%
COLLEGE, 1 YEAR OR MORE
11.6/ 100
METRIC RATING
215th/ 347
METRIC RANK
55.8%
COLLEGE, 1 YEAR OR MORE
1.1/ 100
METRIC RATING
240th/ 347
METRIC RANK
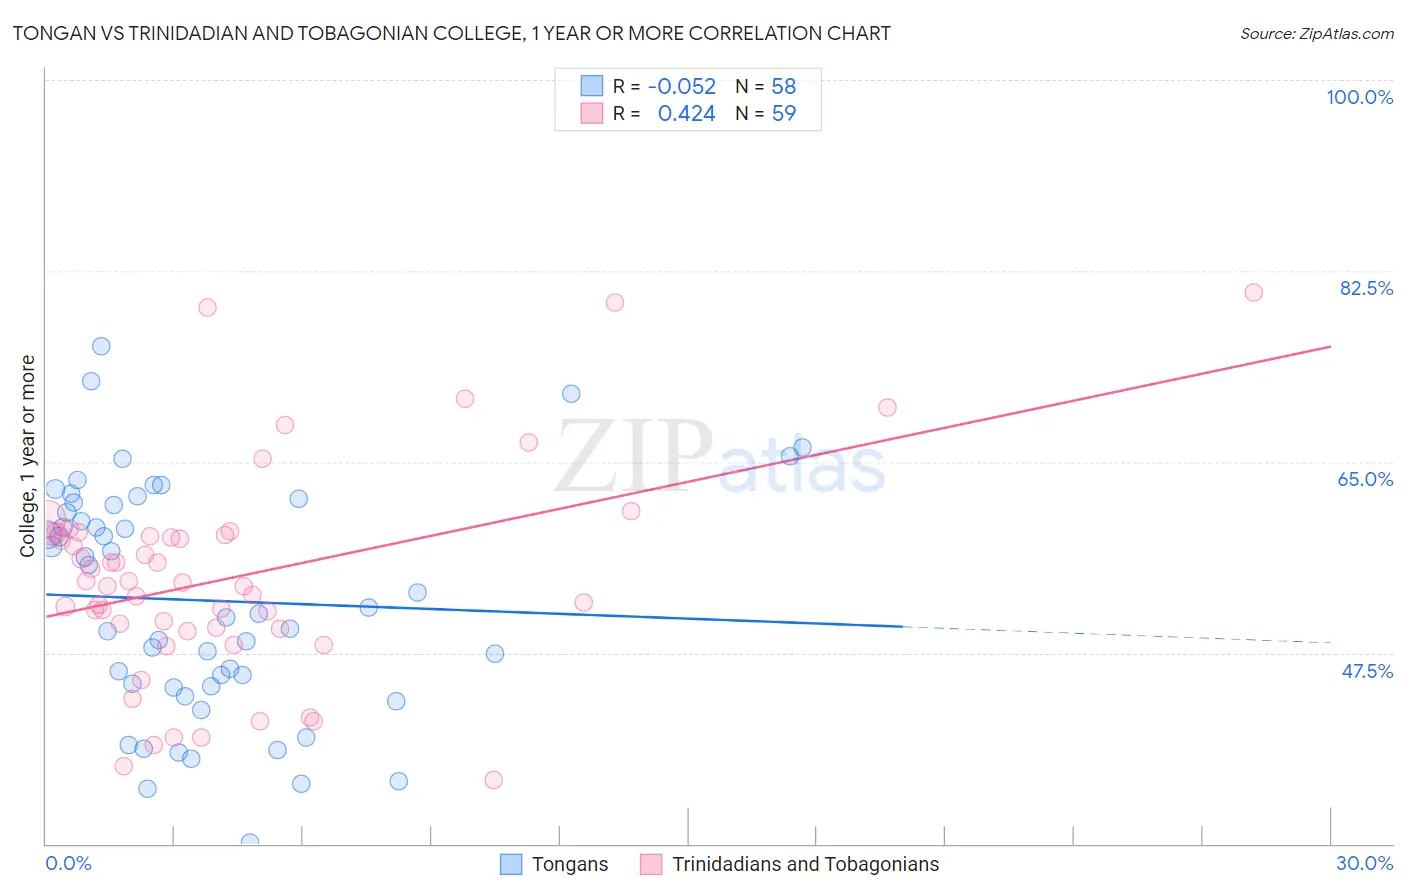
Tongan vs Trinidadian and Tobagonian College, 1 year or more Correlation Chart
The statistical analysis conducted on geographies consisting of 102,908,759 people shows a slight negative correlation between the proportion of Tongans and percentage of population with at least college, 1 year or more education in the United States with a correlation coefficient (R) of -0.052 and weighted average of 57.8%. Similarly, the statistical analysis conducted on geographies consisting of 219,882,137 people shows a moderate positive correlation between the proportion of Trinidadians and Tobagonians and percentage of population with at least college, 1 year or more education in the United States with a correlation coefficient (R) of 0.424 and weighted average of 55.8%, a difference of 3.5%.
College, 1 year or more Correlation Summary
| Measurement | Tongan | Trinidadian and Tobagonian |
| Minimum | 30.2% | 35.8% |
| Maximum | 75.6% | 80.5% |
| Range | 45.4% | 44.7% |
| Mean | 52.3% | 54.4% |
| Median | 51.4% | 54.0% |
| Interquartile 25% (IQ1) | 44.5% | 49.7% |
| Interquartile 75% (IQ3) | 61.1% | 58.4% |
| Interquartile Range (IQR) | 16.6% | 8.7% |
| Standard Deviation (Sample) | 10.5% | 9.7% |
| Standard Deviation (Population) | 10.5% | 9.6% |
Similar Demographics by College, 1 year or more
Demographics Similar to Tongans by College, 1 year or more
In terms of college, 1 year or more, the demographic groups most similar to Tongans are Immigrants from Colombia (57.8%, a difference of 0.0%), Immigrants from Senegal (57.8%, a difference of 0.040%), French Canadian (57.8%, a difference of 0.040%), Immigrants from Peru (57.7%, a difference of 0.13%), and Immigrants from Nigeria (57.9%, a difference of 0.21%).
| Demographics | Rating | Rank | College, 1 year or more |
| Immigrants | Uruguay | 15.2 /100 | #208 | Poor 58.1% |
| Immigrants | Middle Africa | 14.0 /100 | #209 | Poor 58.0% |
| Tsimshian | 13.5 /100 | #210 | Poor 57.9% |
| Immigrants | Nigeria | 13.3 /100 | #211 | Poor 57.9% |
| Immigrants | Senegal | 11.8 /100 | #212 | Poor 57.8% |
| French Canadians | 11.8 /100 | #213 | Poor 57.8% |
| Immigrants | Colombia | 11.6 /100 | #214 | Poor 57.8% |
| Tongans | 11.6 /100 | #215 | Poor 57.8% |
| Immigrants | Peru | 10.6 /100 | #216 | Poor 57.7% |
| Immigrants | Panama | 9.1 /100 | #217 | Tragic 57.6% |
| Native Hawaiians | 9.0 /100 | #218 | Tragic 57.6% |
| Whites/Caucasians | 8.7 /100 | #219 | Tragic 57.6% |
| Immigrants | Costa Rica | 8.0 /100 | #220 | Tragic 57.5% |
| Immigrants | Ghana | 7.7 /100 | #221 | Tragic 57.4% |
| Sub-Saharan Africans | 6.1 /100 | #222 | Tragic 57.3% |
Demographics Similar to Trinidadians and Tobagonians by College, 1 year or more
In terms of college, 1 year or more, the demographic groups most similar to Trinidadians and Tobagonians are French American Indian (55.8%, a difference of 0.050%), Puget Sound Salish (55.9%, a difference of 0.090%), Marshallese (55.8%, a difference of 0.15%), Osage (55.8%, a difference of 0.16%), and Chippewa (55.7%, a difference of 0.28%).
| Demographics | Rating | Rank | College, 1 year or more |
| Immigrants | Nonimmigrants | 2.5 /100 | #233 | Tragic 56.5% |
| Spanish Americans | 1.8 /100 | #234 | Tragic 56.3% |
| West Indians | 1.8 /100 | #235 | Tragic 56.3% |
| Iroquois | 1.7 /100 | #236 | Tragic 56.2% |
| Samoans | 1.6 /100 | #237 | Tragic 56.2% |
| Barbadians | 1.3 /100 | #238 | Tragic 56.0% |
| Puget Sound Salish | 1.1 /100 | #239 | Tragic 55.9% |
| Trinidadians and Tobagonians | 1.1 /100 | #240 | Tragic 55.8% |
| French American Indians | 1.0 /100 | #241 | Tragic 55.8% |
| Marshallese | 1.0 /100 | #242 | Tragic 55.8% |
| Osage | 1.0 /100 | #243 | Tragic 55.8% |
| Chippewa | 0.9 /100 | #244 | Tragic 55.7% |
| Immigrants | Liberia | 0.8 /100 | #245 | Tragic 55.7% |
| Malaysians | 0.8 /100 | #246 | Tragic 55.6% |
| Hawaiians | 0.8 /100 | #247 | Tragic 55.6% |