Croatian vs Seminole College, 1 year or more
COMPARE
Croatian
Seminole
College, 1 year or more
College, 1 year or more Comparison
Croatians
Seminole
62.2%
COLLEGE, 1 YEAR OR MORE
97.1/ 100
METRIC RATING
99th/ 347
METRIC RANK
52.1%
COLLEGE, 1 YEAR OR MORE
0.0/ 100
METRIC RATING
305th/ 347
METRIC RANK
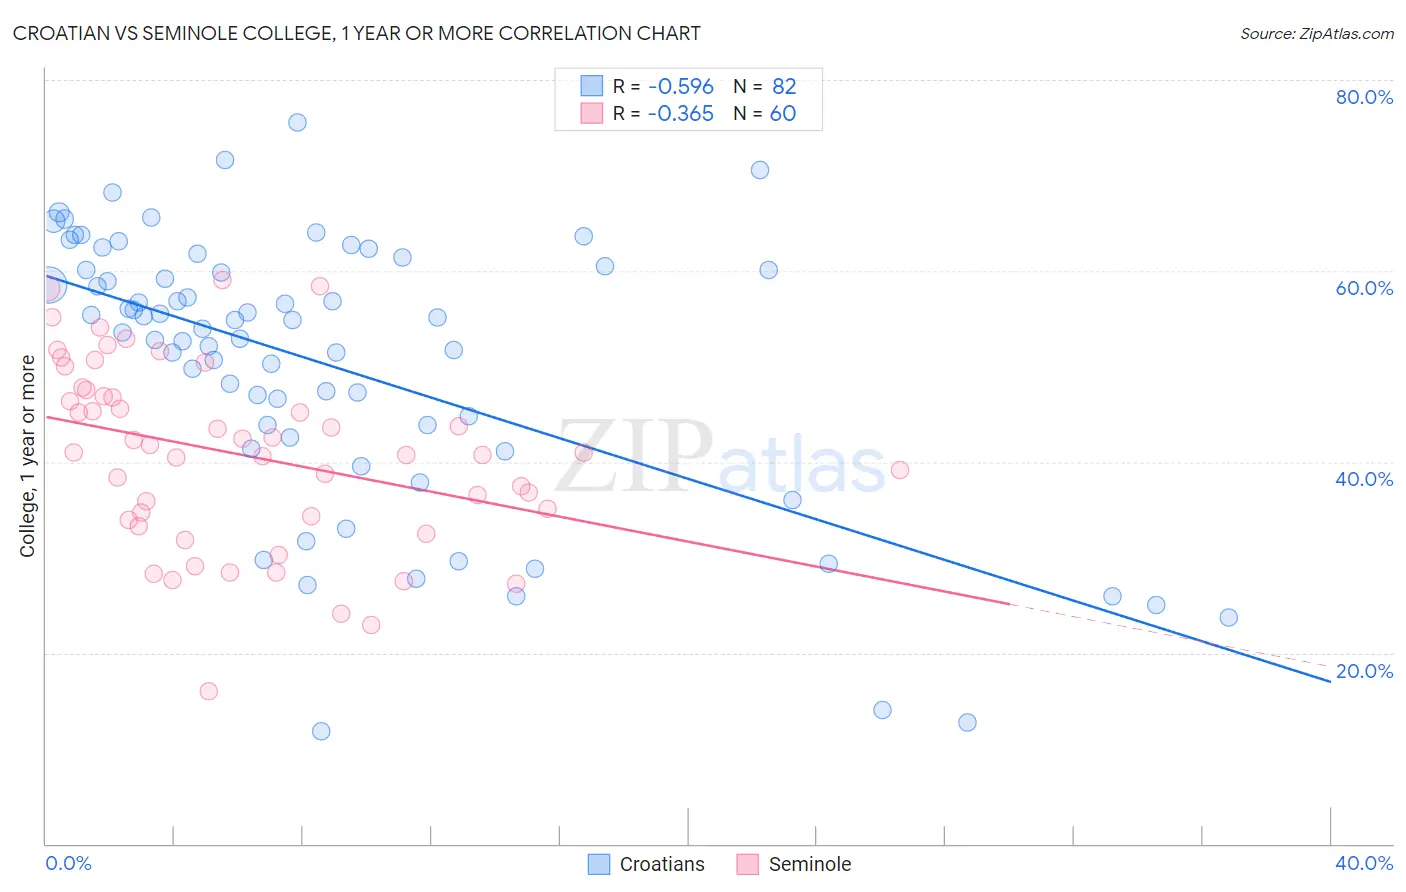
Croatian vs Seminole College, 1 year or more Correlation Chart
The statistical analysis conducted on geographies consisting of 375,729,085 people shows a substantial negative correlation between the proportion of Croatians and percentage of population with at least college, 1 year or more education in the United States with a correlation coefficient (R) of -0.596 and weighted average of 62.2%. Similarly, the statistical analysis conducted on geographies consisting of 118,314,121 people shows a mild negative correlation between the proportion of Seminole and percentage of population with at least college, 1 year or more education in the United States with a correlation coefficient (R) of -0.365 and weighted average of 52.1%, a difference of 19.4%.
College, 1 year or more Correlation Summary
| Measurement | Croatian | Seminole |
| Minimum | 11.7% | 15.9% |
| Maximum | 75.6% | 59.0% |
| Range | 63.8% | 43.1% |
| Mean | 50.1% | 40.7% |
| Median | 54.4% | 41.0% |
| Interquartile 25% (IQ1) | 42.5% | 34.1% |
| Interquartile 75% (IQ3) | 60.2% | 47.2% |
| Interquartile Range (IQR) | 17.6% | 13.1% |
| Standard Deviation (Sample) | 14.4% | 9.6% |
| Standard Deviation (Population) | 14.3% | 9.5% |
Similar Demographics by College, 1 year or more
Demographics Similar to Croatians by College, 1 year or more
In terms of college, 1 year or more, the demographic groups most similar to Croatians are Carpatho Rusyn (62.2%, a difference of 0.0%), Chinese (62.2%, a difference of 0.010%), Jordanian (62.2%, a difference of 0.010%), British (62.3%, a difference of 0.13%), and Icelander (62.1%, a difference of 0.16%).
| Demographics | Rating | Rank | College, 1 year or more |
| Immigrants | Egypt | 97.8 /100 | #92 | Exceptional 62.4% |
| Romanians | 97.7 /100 | #93 | Exceptional 62.4% |
| Immigrants | Croatia | 97.6 /100 | #94 | Exceptional 62.3% |
| British | 97.4 /100 | #95 | Exceptional 62.3% |
| Chinese | 97.2 /100 | #96 | Exceptional 62.2% |
| Jordanians | 97.2 /100 | #97 | Exceptional 62.2% |
| Carpatho Rusyns | 97.2 /100 | #98 | Exceptional 62.2% |
| Croatians | 97.1 /100 | #99 | Exceptional 62.2% |
| Icelanders | 96.8 /100 | #100 | Exceptional 62.1% |
| Swedes | 96.8 /100 | #101 | Exceptional 62.1% |
| Luxembourgers | 96.7 /100 | #102 | Exceptional 62.1% |
| Afghans | 96.4 /100 | #103 | Exceptional 62.0% |
| Chileans | 96.4 /100 | #104 | Exceptional 62.0% |
| Immigrants | Nepal | 96.3 /100 | #105 | Exceptional 62.0% |
| Palestinians | 96.3 /100 | #106 | Exceptional 62.0% |
Demographics Similar to Seminole by College, 1 year or more
In terms of college, 1 year or more, the demographic groups most similar to Seminole are Central American (52.1%, a difference of 0.10%), Creek (52.2%, a difference of 0.23%), Puerto Rican (52.2%, a difference of 0.31%), Mexican American Indian (51.9%, a difference of 0.33%), and Haitian (52.3%, a difference of 0.44%).
| Demographics | Rating | Rank | College, 1 year or more |
| Immigrants | Dominica | 0.0 /100 | #298 | Tragic 52.5% |
| Immigrants | Nicaragua | 0.0 /100 | #299 | Tragic 52.4% |
| Choctaw | 0.0 /100 | #300 | Tragic 52.3% |
| Haitians | 0.0 /100 | #301 | Tragic 52.3% |
| Puerto Ricans | 0.0 /100 | #302 | Tragic 52.2% |
| Creek | 0.0 /100 | #303 | Tragic 52.2% |
| Central Americans | 0.0 /100 | #304 | Tragic 52.1% |
| Seminole | 0.0 /100 | #305 | Tragic 52.1% |
| Mexican American Indians | 0.0 /100 | #306 | Tragic 51.9% |
| Immigrants | Portugal | 0.0 /100 | #307 | Tragic 51.9% |
| Salvadorans | 0.0 /100 | #308 | Tragic 51.8% |
| Apache | 0.0 /100 | #309 | Tragic 51.8% |
| Hondurans | 0.0 /100 | #310 | Tragic 51.6% |
| Immigrants | Haiti | 0.0 /100 | #311 | Tragic 51.5% |
| Pueblo | 0.0 /100 | #312 | Tragic 51.5% |