Croatian vs Trinidadian and Tobagonian 7th Grade
COMPARE
Croatian
Trinidadian and Tobagonian
7th Grade
7th Grade Comparison
Croatians
Trinidadians and Tobagonians
97.4%
7TH GRADE
100.0/ 100
METRIC RATING
23rd/ 347
METRIC RANK
95.2%
7TH GRADE
0.3/ 100
METRIC RATING
269th/ 347
METRIC RANK
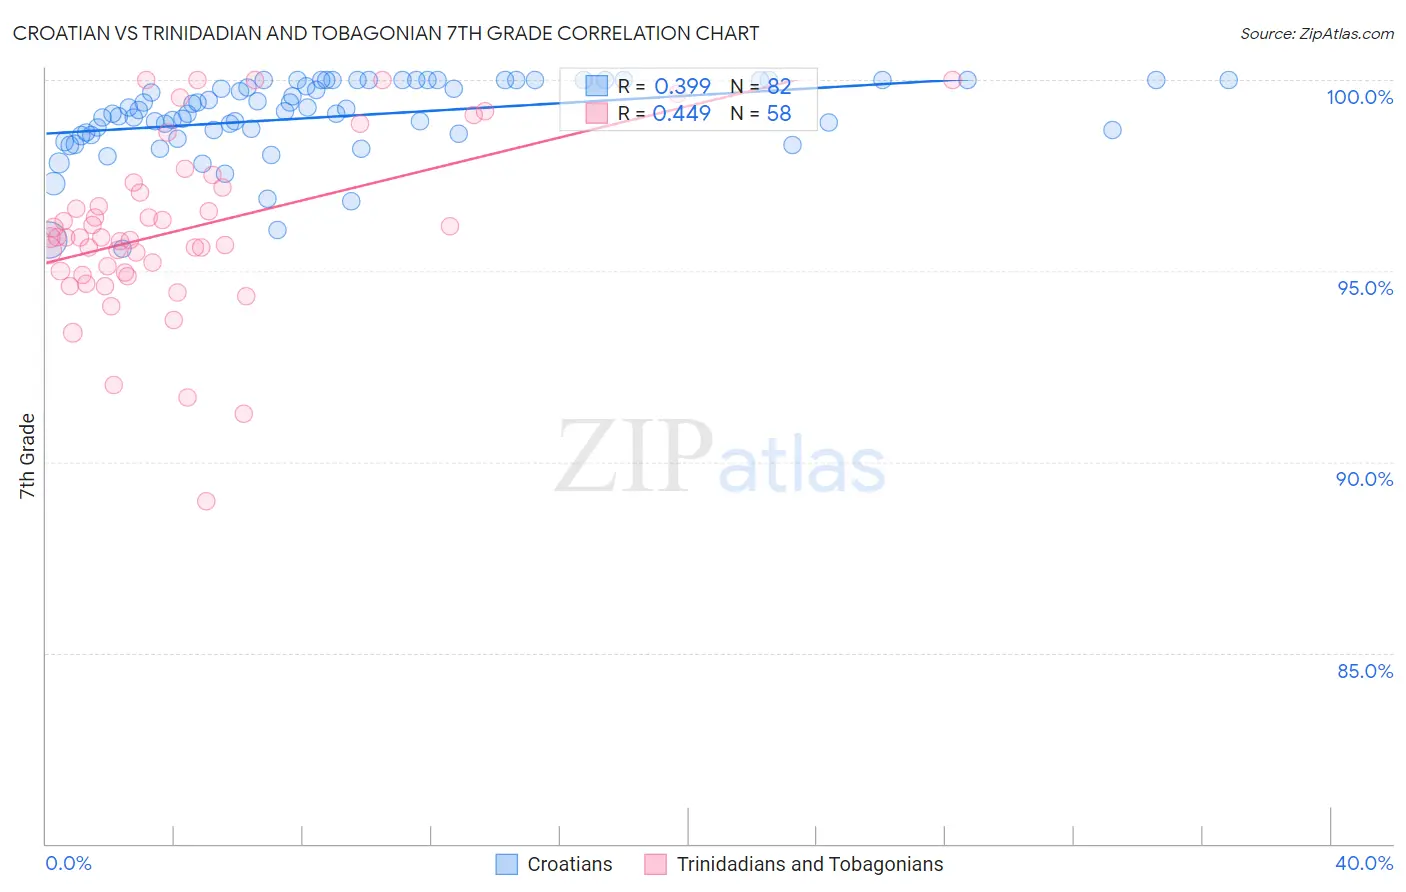
Croatian vs Trinidadian and Tobagonian 7th Grade Correlation Chart
The statistical analysis conducted on geographies consisting of 375,734,226 people shows a mild positive correlation between the proportion of Croatians and percentage of population with at least 7th grade education in the United States with a correlation coefficient (R) of 0.399 and weighted average of 97.4%. Similarly, the statistical analysis conducted on geographies consisting of 219,881,170 people shows a moderate positive correlation between the proportion of Trinidadians and Tobagonians and percentage of population with at least 7th grade education in the United States with a correlation coefficient (R) of 0.449 and weighted average of 95.2%, a difference of 2.4%.
7th Grade Correlation Summary
| Measurement | Croatian | Trinidadian and Tobagonian |
| Minimum | 95.6% | 89.0% |
| Maximum | 100.0% | 100.0% |
| Range | 4.4% | 11.0% |
| Mean | 99.0% | 96.1% |
| Median | 99.2% | 95.9% |
| Interquartile 25% (IQ1) | 98.6% | 95.0% |
| Interquartile 75% (IQ3) | 100.0% | 97.2% |
| Interquartile Range (IQR) | 1.4% | 2.2% |
| Standard Deviation (Sample) | 1.0% | 2.3% |
| Standard Deviation (Population) | 1.0% | 2.2% |
Similar Demographics by 7th Grade
Demographics Similar to Croatians by 7th Grade
In terms of 7th grade, the demographic groups most similar to Croatians are Welsh (97.4%, a difference of 0.010%), Inupiat (97.4%, a difference of 0.020%), French Canadian (97.4%, a difference of 0.020%), French (97.4%, a difference of 0.020%), and Scotch-Irish (97.4%, a difference of 0.020%).
| Demographics | Rating | Rank | 7th Grade |
| Irish | 100.0 /100 | #16 | Exceptional 97.5% |
| Scottish | 100.0 /100 | #17 | Exceptional 97.5% |
| Tlingit-Haida | 100.0 /100 | #18 | Exceptional 97.5% |
| Lithuanians | 100.0 /100 | #19 | Exceptional 97.5% |
| Yup'ik | 100.0 /100 | #20 | Exceptional 97.4% |
| Inupiat | 100.0 /100 | #21 | Exceptional 97.4% |
| French Canadians | 100.0 /100 | #22 | Exceptional 97.4% |
| Croatians | 100.0 /100 | #23 | Exceptional 97.4% |
| Welsh | 100.0 /100 | #24 | Exceptional 97.4% |
| French | 100.0 /100 | #25 | Exceptional 97.4% |
| Scotch-Irish | 100.0 /100 | #26 | Exceptional 97.4% |
| Danes | 100.0 /100 | #27 | Exceptional 97.4% |
| Sioux | 100.0 /100 | #28 | Exceptional 97.4% |
| Scandinavians | 100.0 /100 | #29 | Exceptional 97.4% |
| Czechs | 100.0 /100 | #30 | Exceptional 97.4% |
Demographics Similar to Trinidadians and Tobagonians by 7th Grade
In terms of 7th grade, the demographic groups most similar to Trinidadians and Tobagonians are Immigrants from Hong Kong (95.2%, a difference of 0.020%), Houma (95.1%, a difference of 0.020%), Immigrants from South America (95.1%, a difference of 0.020%), Peruvian (95.1%, a difference of 0.020%), and Immigrants from Uzbekistan (95.1%, a difference of 0.020%).
| Demographics | Rating | Rank | 7th Grade |
| Immigrants | Somalia | 0.5 /100 | #262 | Tragic 95.2% |
| West Indians | 0.5 /100 | #263 | Tragic 95.2% |
| Immigrants | Nigeria | 0.4 /100 | #264 | Tragic 95.2% |
| Immigrants | Uruguay | 0.3 /100 | #265 | Tragic 95.2% |
| Immigrants | Ghana | 0.3 /100 | #266 | Tragic 95.2% |
| Yuman | 0.3 /100 | #267 | Tragic 95.2% |
| Immigrants | Hong Kong | 0.3 /100 | #268 | Tragic 95.2% |
| Trinidadians and Tobagonians | 0.3 /100 | #269 | Tragic 95.2% |
| Houma | 0.2 /100 | #270 | Tragic 95.1% |
| Immigrants | South America | 0.2 /100 | #271 | Tragic 95.1% |
| Peruvians | 0.2 /100 | #272 | Tragic 95.1% |
| Immigrants | Uzbekistan | 0.2 /100 | #273 | Tragic 95.1% |
| Immigrants | Western Africa | 0.2 /100 | #274 | Tragic 95.1% |
| Immigrants | Colombia | 0.2 /100 | #275 | Tragic 95.1% |
| Immigrants | Thailand | 0.2 /100 | #276 | Tragic 95.1% |