Croatian vs Trinidadian and Tobagonian Single Father Households
COMPARE
Croatian
Trinidadian and Tobagonian
Single Father Households
Single Father Households Comparison
Croatians
Trinidadians and Tobagonians
2.1%
SINGLE FATHER HOUSEHOLDS
99.3/ 100
METRIC RATING
93rd/ 347
METRIC RANK
2.2%
SINGLE FATHER HOUSEHOLDS
97.8/ 100
METRIC RATING
119th/ 347
METRIC RANK
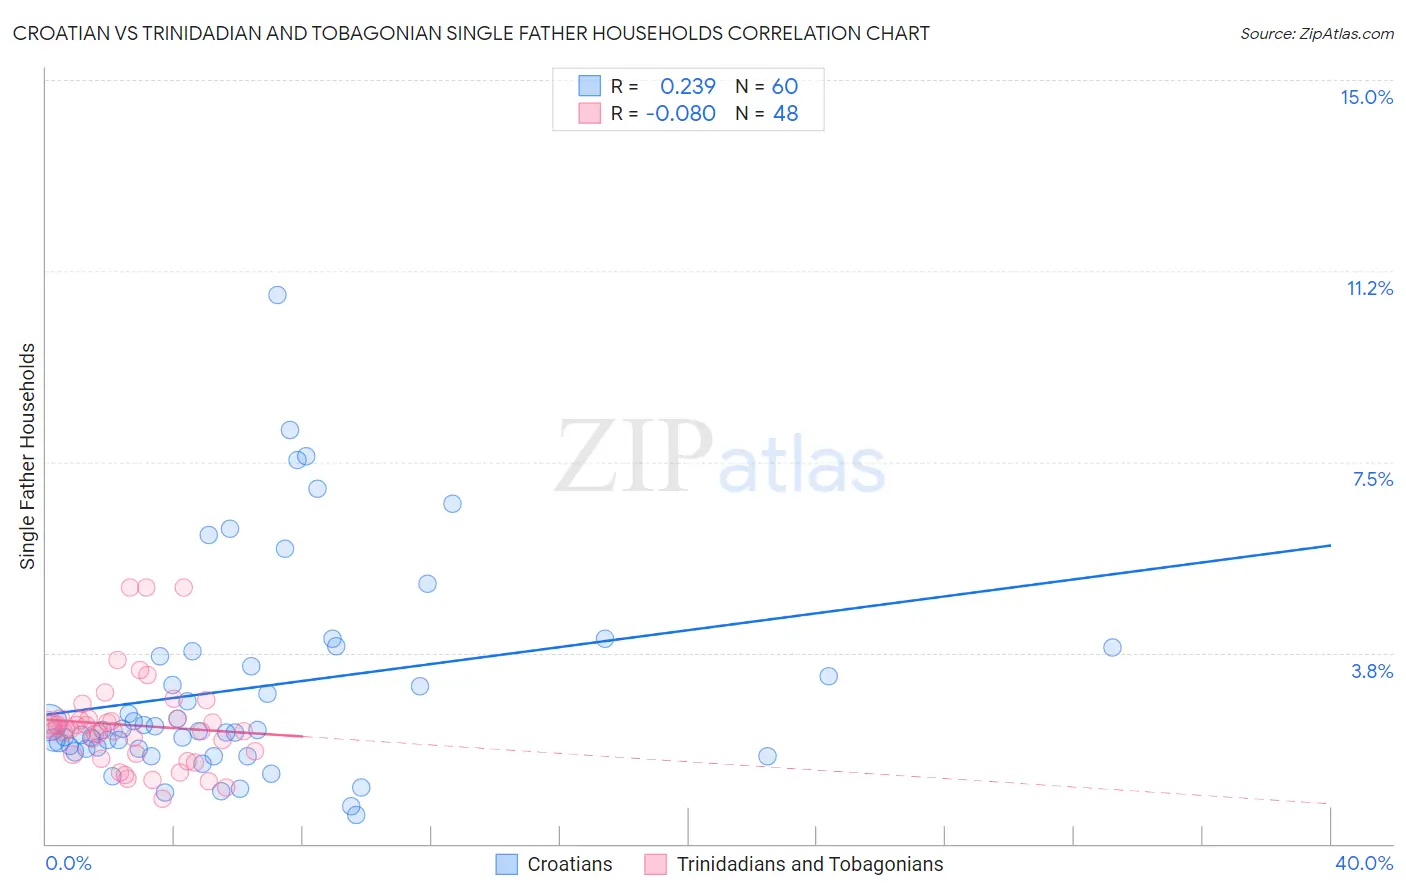
Croatian vs Trinidadian and Tobagonian Single Father Households Correlation Chart
The statistical analysis conducted on geographies consisting of 372,052,668 people shows a weak positive correlation between the proportion of Croatians and percentage of single father households in the United States with a correlation coefficient (R) of 0.239 and weighted average of 2.1%. Similarly, the statistical analysis conducted on geographies consisting of 218,763,381 people shows a slight negative correlation between the proportion of Trinidadians and Tobagonians and percentage of single father households in the United States with a correlation coefficient (R) of -0.080 and weighted average of 2.2%, a difference of 2.4%.
Single Father Households Correlation Summary
| Measurement | Croatian | Trinidadian and Tobagonian |
| Minimum | 0.56% | 0.89% |
| Maximum | 10.8% | 5.0% |
| Range | 10.2% | 4.2% |
| Mean | 3.1% | 2.3% |
| Median | 2.2% | 2.2% |
| Interquartile 25% (IQ1) | 1.9% | 1.8% |
| Interquartile 75% (IQ3) | 3.7% | 2.5% |
| Interquartile Range (IQR) | 1.9% | 0.69% |
| Standard Deviation (Sample) | 2.1% | 0.92% |
| Standard Deviation (Population) | 2.1% | 0.91% |
Similar Demographics by Single Father Households
Demographics Similar to Croatians by Single Father Households
In terms of single father households, the demographic groups most similar to Croatians are Ukrainian (2.1%, a difference of 0.0%), Romanian (2.1%, a difference of 0.11%), Immigrants from Guyana (2.1%, a difference of 0.20%), Bermudan (2.1%, a difference of 0.23%), and Arab (2.1%, a difference of 0.37%).
| Demographics | Rating | Rank | Single Father Households |
| Asians | 99.6 /100 | #86 | Exceptional 2.1% |
| Lithuanians | 99.5 /100 | #87 | Exceptional 2.1% |
| Bhutanese | 99.5 /100 | #88 | Exceptional 2.1% |
| Immigrants | Armenia | 99.5 /100 | #89 | Exceptional 2.1% |
| Immigrants | Pakistan | 99.5 /100 | #90 | Exceptional 2.1% |
| Immigrants | Guyana | 99.4 /100 | #91 | Exceptional 2.1% |
| Romanians | 99.4 /100 | #92 | Exceptional 2.1% |
| Croatians | 99.3 /100 | #93 | Exceptional 2.1% |
| Ukrainians | 99.3 /100 | #94 | Exceptional 2.1% |
| Bermudans | 99.2 /100 | #95 | Exceptional 2.1% |
| Arabs | 99.2 /100 | #96 | Exceptional 2.1% |
| Immigrants | Moldova | 99.1 /100 | #97 | Exceptional 2.1% |
| Guyanese | 99.1 /100 | #98 | Exceptional 2.1% |
| South Africans | 99.1 /100 | #99 | Exceptional 2.1% |
| Immigrants | Northern Africa | 99.0 /100 | #100 | Exceptional 2.1% |
Demographics Similar to Trinidadians and Tobagonians by Single Father Households
In terms of single father households, the demographic groups most similar to Trinidadians and Tobagonians are Australian (2.2%, a difference of 0.030%), Immigrants from Brazil (2.2%, a difference of 0.040%), Immigrants from Morocco (2.2%, a difference of 0.060%), Immigrants from Iraq (2.2%, a difference of 0.13%), and Hungarian (2.2%, a difference of 0.16%).
| Demographics | Rating | Rank | Single Father Households |
| Immigrants | Trinidad and Tobago | 98.2 /100 | #112 | Exceptional 2.2% |
| Iraqis | 98.2 /100 | #113 | Exceptional 2.2% |
| Immigrants | North America | 98.2 /100 | #114 | Exceptional 2.2% |
| Immigrants | Barbados | 98.2 /100 | #115 | Exceptional 2.2% |
| Immigrants | Argentina | 98.1 /100 | #116 | Exceptional 2.2% |
| Hungarians | 97.9 /100 | #117 | Exceptional 2.2% |
| Immigrants | Morocco | 97.8 /100 | #118 | Exceptional 2.2% |
| Trinidadians and Tobagonians | 97.8 /100 | #119 | Exceptional 2.2% |
| Australians | 97.7 /100 | #120 | Exceptional 2.2% |
| Immigrants | Brazil | 97.7 /100 | #121 | Exceptional 2.2% |
| Immigrants | Iraq | 97.6 /100 | #122 | Exceptional 2.2% |
| Immigrants | Yemen | 97.5 /100 | #123 | Exceptional 2.2% |
| British West Indians | 97.4 /100 | #124 | Exceptional 2.2% |
| Immigrants | Indonesia | 97.4 /100 | #125 | Exceptional 2.2% |
| Moroccans | 96.9 /100 | #126 | Exceptional 2.2% |