Croatian vs Immigrants from Ukraine College, 1 year or more
COMPARE
Croatian
Immigrants from Ukraine
College, 1 year or more
College, 1 year or more Comparison
Croatians
Immigrants from Ukraine
62.2%
COLLEGE, 1 YEAR OR MORE
97.1/ 100
METRIC RATING
99th/ 347
METRIC RANK
61.9%
COLLEGE, 1 YEAR OR MORE
95.8/ 100
METRIC RATING
107th/ 347
METRIC RANK
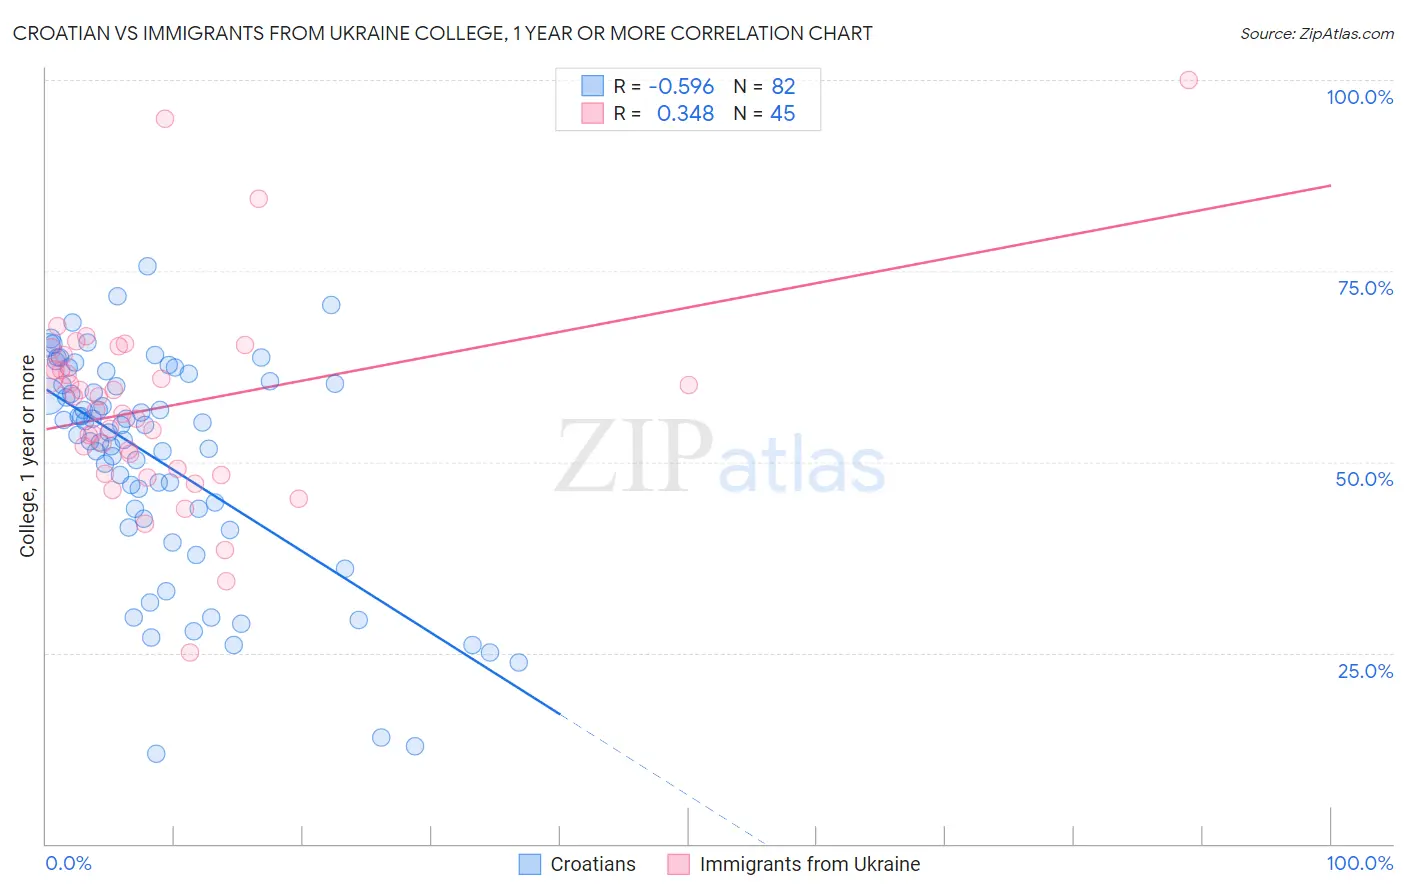
Croatian vs Immigrants from Ukraine College, 1 year or more Correlation Chart
The statistical analysis conducted on geographies consisting of 375,729,085 people shows a substantial negative correlation between the proportion of Croatians and percentage of population with at least college, 1 year or more education in the United States with a correlation coefficient (R) of -0.596 and weighted average of 62.2%. Similarly, the statistical analysis conducted on geographies consisting of 289,712,941 people shows a mild positive correlation between the proportion of Immigrants from Ukraine and percentage of population with at least college, 1 year or more education in the United States with a correlation coefficient (R) of 0.348 and weighted average of 61.9%, a difference of 0.52%.
College, 1 year or more Correlation Summary
| Measurement | Croatian | Immigrants from Ukraine |
| Minimum | 11.7% | 25.0% |
| Maximum | 75.6% | 100.0% |
| Range | 63.8% | 75.0% |
| Mean | 50.1% | 57.2% |
| Median | 54.4% | 56.8% |
| Interquartile 25% (IQ1) | 42.5% | 48.8% |
| Interquartile 75% (IQ3) | 60.2% | 63.0% |
| Interquartile Range (IQR) | 17.6% | 14.2% |
| Standard Deviation (Sample) | 14.4% | 13.4% |
| Standard Deviation (Population) | 14.3% | 13.2% |
Demographics Similar to Croatians and Immigrants from Ukraine by College, 1 year or more
In terms of college, 1 year or more, the demographic groups most similar to Croatians are Carpatho Rusyn (62.2%, a difference of 0.0%), Chinese (62.2%, a difference of 0.010%), Jordanian (62.2%, a difference of 0.010%), British (62.3%, a difference of 0.13%), and Icelander (62.1%, a difference of 0.16%). Similarly, the demographic groups most similar to Immigrants from Ukraine are Syrian (61.9%, a difference of 0.020%), Immigrants from Northern Africa (61.9%, a difference of 0.020%), European (61.8%, a difference of 0.040%), Macedonian (61.8%, a difference of 0.040%), and Austrian (61.8%, a difference of 0.10%).
| Demographics | Rating | Rank | College, 1 year or more |
| Romanians | 97.7 /100 | #93 | Exceptional 62.4% |
| Immigrants | Croatia | 97.6 /100 | #94 | Exceptional 62.3% |
| British | 97.4 /100 | #95 | Exceptional 62.3% |
| Chinese | 97.2 /100 | #96 | Exceptional 62.2% |
| Jordanians | 97.2 /100 | #97 | Exceptional 62.2% |
| Carpatho Rusyns | 97.2 /100 | #98 | Exceptional 62.2% |
| Croatians | 97.1 /100 | #99 | Exceptional 62.2% |
| Icelanders | 96.8 /100 | #100 | Exceptional 62.1% |
| Swedes | 96.8 /100 | #101 | Exceptional 62.1% |
| Luxembourgers | 96.7 /100 | #102 | Exceptional 62.1% |
| Afghans | 96.4 /100 | #103 | Exceptional 62.0% |
| Chileans | 96.4 /100 | #104 | Exceptional 62.0% |
| Immigrants | Nepal | 96.3 /100 | #105 | Exceptional 62.0% |
| Palestinians | 96.3 /100 | #106 | Exceptional 62.0% |
| Immigrants | Ukraine | 95.8 /100 | #107 | Exceptional 61.9% |
| Syrians | 95.7 /100 | #108 | Exceptional 61.9% |
| Immigrants | Northern Africa | 95.7 /100 | #109 | Exceptional 61.9% |
| Europeans | 95.6 /100 | #110 | Exceptional 61.8% |
| Macedonians | 95.6 /100 | #111 | Exceptional 61.8% |
| Austrians | 95.4 /100 | #112 | Exceptional 61.8% |
| Ukrainians | 95.2 /100 | #113 | Exceptional 61.8% |