Croatian vs Immigrants from Kuwait College, 1 year or more
COMPARE
Croatian
Immigrants from Kuwait
College, 1 year or more
College, 1 year or more Comparison
Croatians
Immigrants from Kuwait
62.2%
COLLEGE, 1 YEAR OR MORE
97.1/ 100
METRIC RATING
99th/ 347
METRIC RANK
65.0%
COLLEGE, 1 YEAR OR MORE
99.9/ 100
METRIC RATING
40th/ 347
METRIC RANK
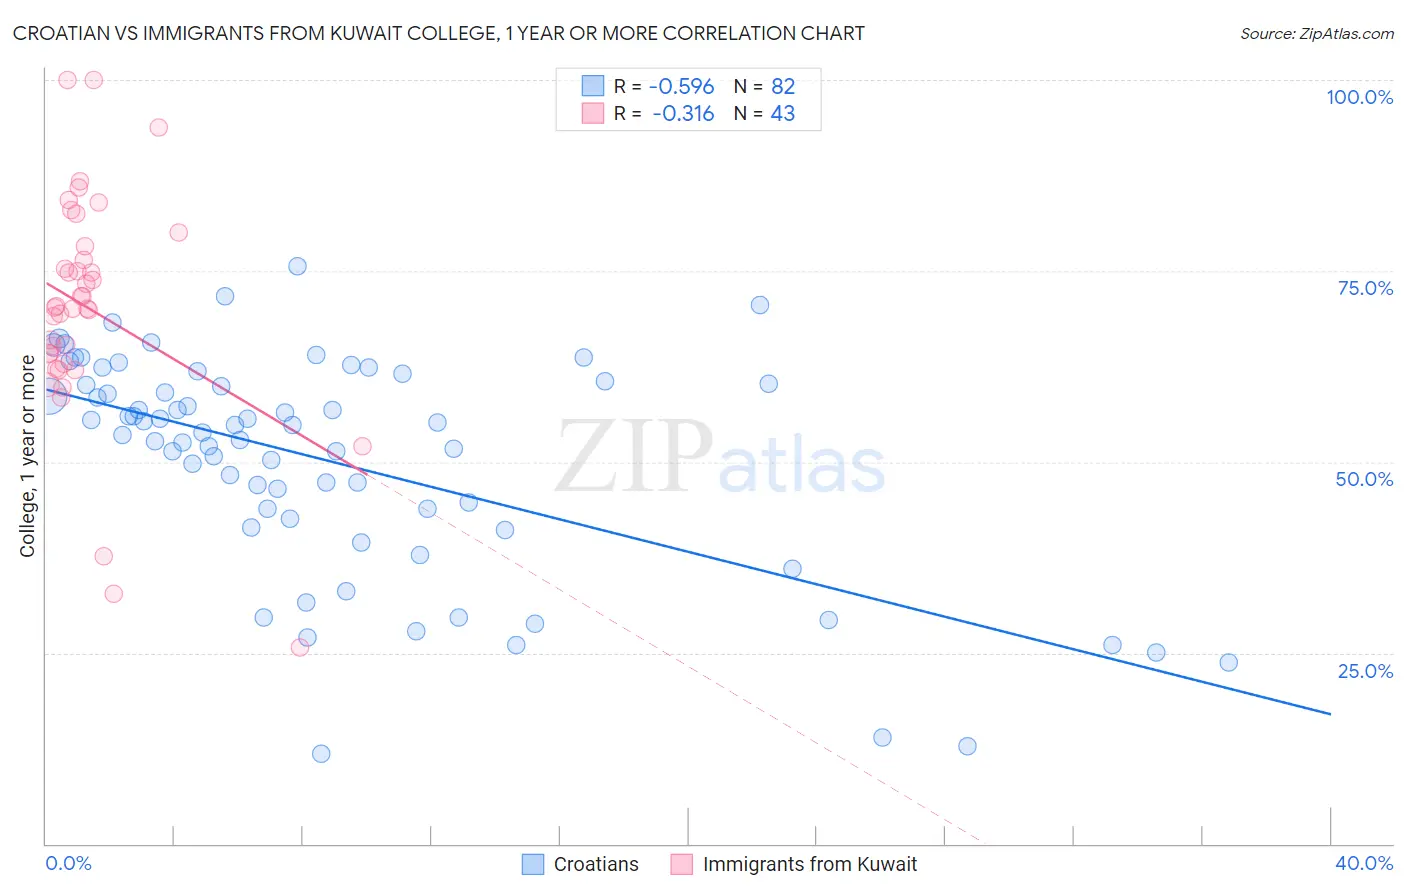
Croatian vs Immigrants from Kuwait College, 1 year or more Correlation Chart
The statistical analysis conducted on geographies consisting of 375,729,085 people shows a substantial negative correlation between the proportion of Croatians and percentage of population with at least college, 1 year or more education in the United States with a correlation coefficient (R) of -0.596 and weighted average of 62.2%. Similarly, the statistical analysis conducted on geographies consisting of 136,917,085 people shows a mild negative correlation between the proportion of Immigrants from Kuwait and percentage of population with at least college, 1 year or more education in the United States with a correlation coefficient (R) of -0.316 and weighted average of 65.0%, a difference of 4.4%.
College, 1 year or more Correlation Summary
| Measurement | Croatian | Immigrants from Kuwait |
| Minimum | 11.7% | 25.7% |
| Maximum | 75.6% | 100.0% |
| Range | 63.8% | 74.3% |
| Mean | 50.1% | 70.1% |
| Median | 54.4% | 70.2% |
| Interquartile 25% (IQ1) | 42.5% | 62.8% |
| Interquartile 75% (IQ3) | 60.2% | 78.3% |
| Interquartile Range (IQR) | 17.6% | 15.4% |
| Standard Deviation (Sample) | 14.4% | 14.9% |
| Standard Deviation (Population) | 14.3% | 14.8% |
Similar Demographics by College, 1 year or more
Demographics Similar to Croatians by College, 1 year or more
In terms of college, 1 year or more, the demographic groups most similar to Croatians are Carpatho Rusyn (62.2%, a difference of 0.0%), Chinese (62.2%, a difference of 0.010%), Jordanian (62.2%, a difference of 0.010%), British (62.3%, a difference of 0.13%), and Icelander (62.1%, a difference of 0.16%).
| Demographics | Rating | Rank | College, 1 year or more |
| Immigrants | Egypt | 97.8 /100 | #92 | Exceptional 62.4% |
| Romanians | 97.7 /100 | #93 | Exceptional 62.4% |
| Immigrants | Croatia | 97.6 /100 | #94 | Exceptional 62.3% |
| British | 97.4 /100 | #95 | Exceptional 62.3% |
| Chinese | 97.2 /100 | #96 | Exceptional 62.2% |
| Jordanians | 97.2 /100 | #97 | Exceptional 62.2% |
| Carpatho Rusyns | 97.2 /100 | #98 | Exceptional 62.2% |
| Croatians | 97.1 /100 | #99 | Exceptional 62.2% |
| Icelanders | 96.8 /100 | #100 | Exceptional 62.1% |
| Swedes | 96.8 /100 | #101 | Exceptional 62.1% |
| Luxembourgers | 96.7 /100 | #102 | Exceptional 62.1% |
| Afghans | 96.4 /100 | #103 | Exceptional 62.0% |
| Chileans | 96.4 /100 | #104 | Exceptional 62.0% |
| Immigrants | Nepal | 96.3 /100 | #105 | Exceptional 62.0% |
| Palestinians | 96.3 /100 | #106 | Exceptional 62.0% |
Demographics Similar to Immigrants from Kuwait by College, 1 year or more
In terms of college, 1 year or more, the demographic groups most similar to Immigrants from Kuwait are Estonian (65.0%, a difference of 0.060%), Immigrants from Saudi Arabia (65.0%, a difference of 0.13%), Mongolian (64.8%, a difference of 0.20%), Immigrants from Latvia (64.8%, a difference of 0.21%), and Russian (65.1%, a difference of 0.28%).
| Demographics | Rating | Rank | College, 1 year or more |
| Immigrants | Sri Lanka | 99.9 /100 | #33 | Exceptional 65.4% |
| Israelis | 99.9 /100 | #34 | Exceptional 65.3% |
| Immigrants | Turkey | 99.9 /100 | #35 | Exceptional 65.2% |
| Immigrants | South Africa | 99.9 /100 | #36 | Exceptional 65.1% |
| Russians | 99.9 /100 | #37 | Exceptional 65.1% |
| Immigrants | Saudi Arabia | 99.9 /100 | #38 | Exceptional 65.0% |
| Estonians | 99.9 /100 | #39 | Exceptional 65.0% |
| Immigrants | Kuwait | 99.9 /100 | #40 | Exceptional 65.0% |
| Mongolians | 99.9 /100 | #41 | Exceptional 64.8% |
| Immigrants | Latvia | 99.9 /100 | #42 | Exceptional 64.8% |
| Immigrants | Russia | 99.9 /100 | #43 | Exceptional 64.7% |
| Immigrants | Norway | 99.9 /100 | #44 | Exceptional 64.7% |
| Immigrants | Lithuania | 99.9 /100 | #45 | Exceptional 64.6% |
| Bhutanese | 99.9 /100 | #46 | Exceptional 64.6% |
| Australians | 99.9 /100 | #47 | Exceptional 64.6% |